How To Update the OpenMRS Data Model Diagram
Introduction
This page gives step by step instructions on how to update the data model diagram of OpenMRS. Changes to the data model are unavoidable in a continuously developing system and having properly updated data model diagrams help the developers and users to view the changes pictorially, thus leading to a better understanding of the changes.
The easiest way to update the Data Model diagram is to download the most recent one from the Data Model page in the MySQL Workbench format and edit it through MySQL Workbench. This guide follows that approach because creating the diagram for a new release from scratch is too troublesome.
Steps
- Find the most recent data model diagram from the Data Model page. Download the MySQL Workbench format of that diagram.
- Find the list of data model changes that are required to be applied to the diagram you downloaded. You can easily do this using the Groovy script that is given in this page. For the 'from' variable, set the version for which the most recent diagram exists. i.e. the version of the diagram you downloaded in step 1. For the 'to' variable, set the version of the release for which you need to create the new diagram. After setting these two variables, you can run the script and it will give you the list of changes as follows:
* (Fixed)Modified edit_privilege to correct column size
* (Fixed)Add a table to enable generic storage of serialized objects
* (Fixed)users.retired to BOOLEAN*
- Next, find the liquibase-update-to-latest.xml file for the release that you are creating the diagram for. It can be found in; https://github.com/OpenMRS/openmrs-core/blob/@VERSION@/api/src/main/resources/liquibase-update-to-latest.xml, where the "VERSION" should be replaced by the version you entered for the 'to' variable in the above step.
- Now, for each item in the list of changes, find what exactly needs to be changed in the diagram. You can do this by doing a search for each item in the liquibase-update-to-latest.xml. For example the change that is required for the first item in the list ((Fixed)Modified edit_privilege to correct column size) is as follows.
<changeSet id="1-fix" author="sunbiz" dbms="mysql">
		<preConditions onFail="MARK_RAN">
			<columnExists tableName="person_attribute_type" columnName="edit_privilege"/>
		</preConditions>
		<comment>(Fixed)Modified edit_privilege to correct column size</comment>
		<modifyDataType tableName="person_attribute_type" columnName="edit_privilege" newDataType="varchar(50)"/>
	</changeSet>
- When you have found the xml tag pertaining to the change, go ahead and apply the change in the diagram. For example, for the above tag, we have to open the person_attribute_type table and modify the datatype of the edit_priviledge column to varchar(50).
Common Changes and How to Apply Them in the Diagram
Adding a new table:
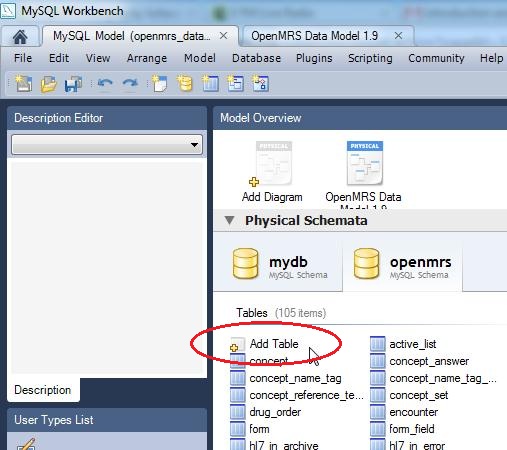
- To add a new table, click the MySQL Tab on the very top of the program, and then click on the openmrs database icon and then finally click the Add Table link as shown in the following picture.
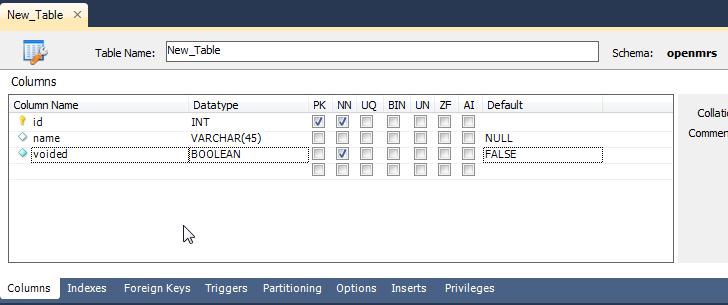
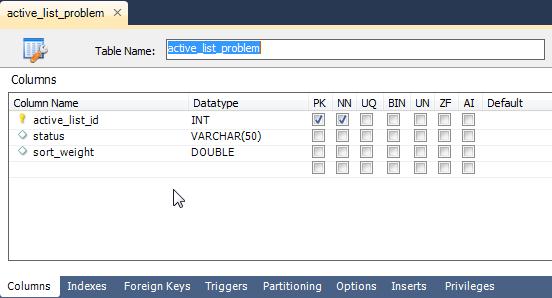
- Once you click the Add Table button, you will have to specify the new columns, their properties, data types in the form which appears at the bottom of the program. If the new table needs has any indexes or foreign keys, you can add their details by clicking the Indexes and Foreign Keys Tabs respectively.
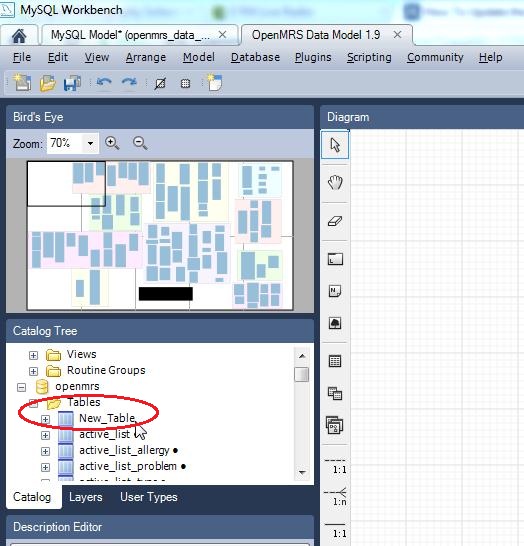
- Once you are done filling in the details, save the model by pressing CTRL+S. Next, to add the new table to the diagram, click the OpenMRS Data Model tab at the very top and go to the diagram view. Then find the newly created table from the table list in the Catalog Tree pane as shown in the following picture. Then click it and drag it to the place you want in the diagram, while holding down the mouse button. The foreign key links will automatically be added once you place the table in the diagram.
Changing Table Properties:
If you want to change the properties of a certain table you have perform the following steps.
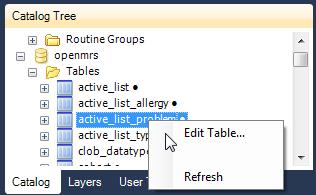
- Find the table you want to change from the table list in the Catalog Tree pane. Then right click the table and click Edit Table.
- Then, in the form that appears make the changes as required. The changes can include data type changes, index changes, foreign key changes etc. They can be done in the same form.
Changing Data Model Version:
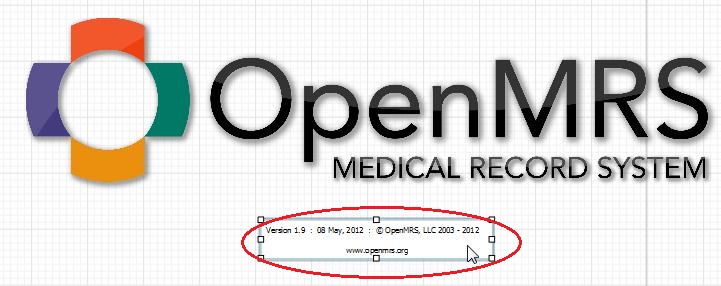
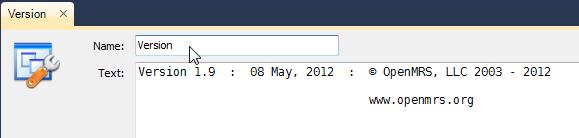
- The version of the diagram can be changed by double clicking on the version information box as shown below.
- Then fill in the form which appears as required.
Exporting the Diagrams
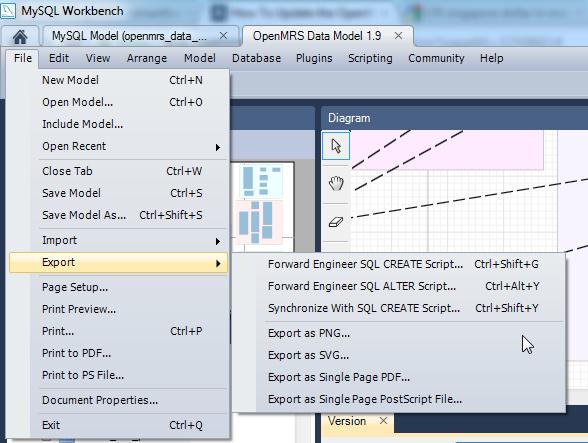
- The data model diagram should be exported as SVG using File → Export → Export as SVG.
Post-Processing
If you have any trouble with these post-processing steps, contact Burke Mamlin for help.
Lighten Relationship Lines
Once the SVG has been created, the following steps can be used to lighten the lines between tables (foreign key relationships):
- Open the SVG in a text editor capable of performing regular expression search & replace (e.g., Sublime Text 2)
- Perform the following search & replaces
- Globally replace
with
^(<path style="fill:none;stroke-width:\[1\|3\];\[^>\]+)(rgb\(0%,0%,0%\))
\1rgb(60%,100%,60%)
- Globally replace
with
^<g style="fill:rgb\(0%,0%,0%\);fill-opacity:1;">\n <use xlink:href="#glyph2-(\[12\])
<g style="fill:rgb(60%,60%,60%);fill-opacity:1;">\n <use xlink:href="#glyph2-\1
- Globally replace
- Save the changes and open the SVG. If it worked, then the relationship lines should be lighter.
Convert SVG to PNG
Use a tool like ImageMagick to convert the SVG to a PNG file using 96 dpi:
$ convert -density 96x96 openmrs_data_model_1.9.0.svg openmrs_data_model_1.9.0.png
then create a thumbnail:
$ convert -scale 300 openmrs_data_model_1.9.0.png openmrs_data_model_1.9.0_thumb.png
Special Notes
- Most of the tables have foreign key relationships to the user.user_id. (e.g. most tables have created_by, voided_by, changed_by columns which have foreign key relationships to user.user_id). As these links clutter the diagram, do not add them while drawing the diagram.
- Once the diagram is completed upload the SVG, PNG files and the MySQL workbench file to the Data Model page and create the relevant links to the attachments.