Building Reports (Step By Step Guide)
Building Reports Inside OpenMRS (For Implementers)
You can create three different types of reports: a Period Indicator Report, a Row-Per-Patient Report, or a Custom Report (Advanced).
All reports contain a Report Definition which is linked to one or more Data Set Definitions. In the first two options, the link between the Report Definition and the appropriate Data Set Definition is set automatically. However, to create a Custom Report (Advanced), you must manually link the Report Definition and Data Set Definition. For more information, see Types of Reports.
The two tutorials that follow demonstrate how to build a Period Indicator Report and a Simple Row-Per-Patient Report. The first example shows a report where the link between the Report and Data Set Definitions is automatic, whereas the second shows a manual setting of the link.
Building Row-Per-Domain Reports
Building a Simple Row-Per-Patient Step-By-Step
This step-by-step tutorial will guide the user in the creation of a Simple Row-Per-Patient Report (See Row-Per-Domain Object Report Definition for details). It will also show how to create the Data Set Definition for the Report Definition.
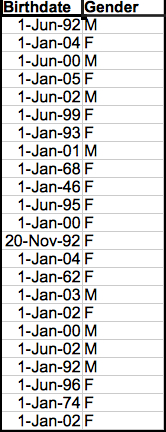
This Simple Row-Per-Patient Report will output a list of patients from Boston and output their birthdate and gender.
Step 1. Build Data Set Definition
Step 2. Build Report
Step 3. Add Data Set to Report
Step 1. Build Data Set Definition
1 | Click 'Administration' from the main toolbar. |
|
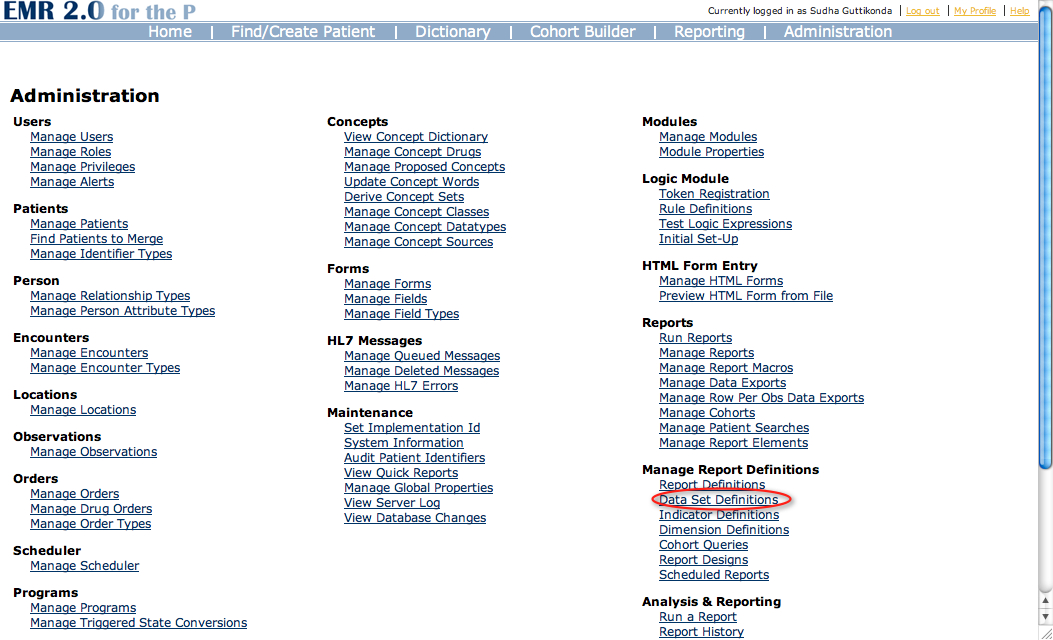
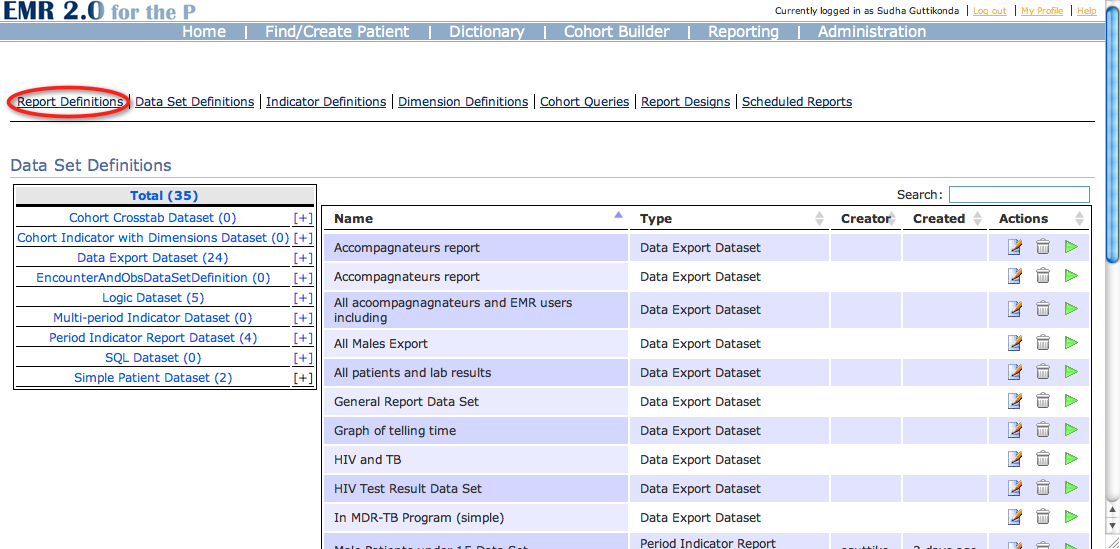
2 | Under 'Manage Report Definitions', click 'Data Set Definitions'. |
|
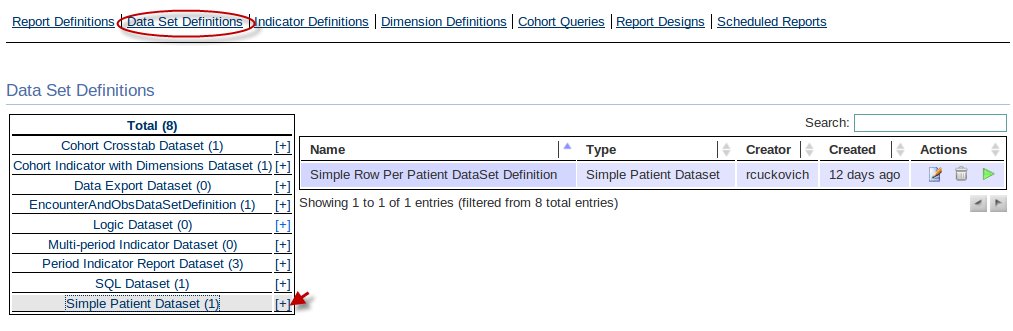
3 | Click the plus sign next to Simple Patient Data Set to add a new Simple Row Per Patient Data Set. |
|
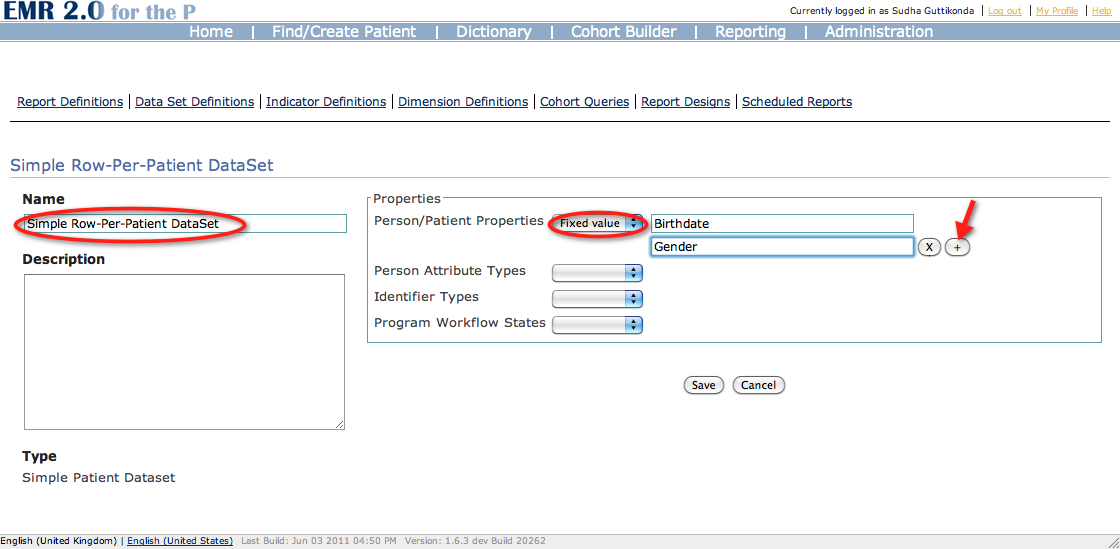
4 | Basics: Under 'Name', input the title of your Data Set, so that you can find it later. You can type a more detailed description under 'Description.' |
|
5 | Properties: There are four different categories of patient properties you can display in your report: person/patient properties, person attribute types, identifier types, and program workflow states. Under each, you can input Fixed Value properties, or parameters, which will allow the data set to be reused. For example, if you input one column as a parameter, you can pass in at runtime what you want this column to contain under the appropriate category. |
|
You are now ready to build the Report Definition.
Step 2. Build Report Definition
1 | Click 'Report Definitions' from the toolbar above. |
|
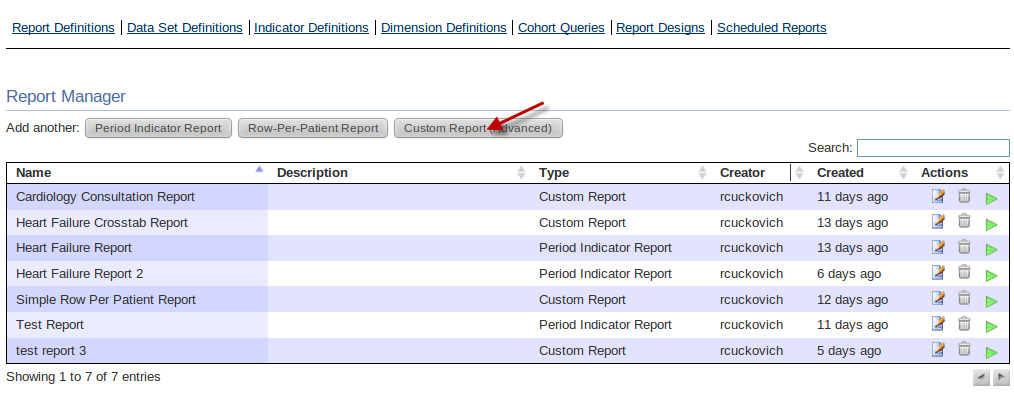
2 | Click 'Custom Report (Advanced)'. |
|
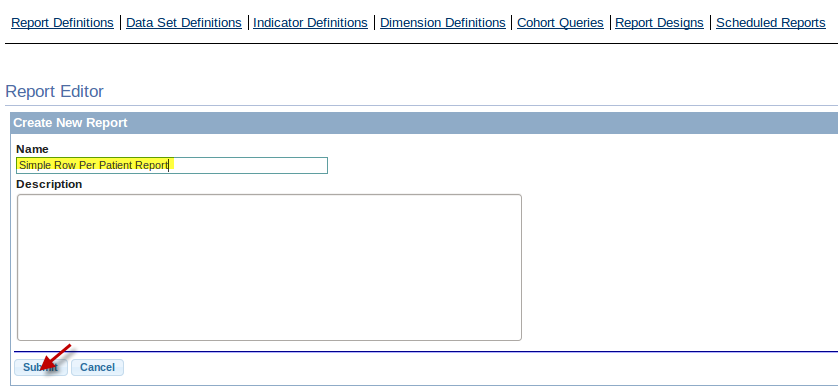
3 | Enter the name of your report under 'Name.' You can enter a more detailed description in the 'Description' textbox. Then click 'Submit.' |
|
You are now ready to add the Data Set you created in Step 1 to your new Report Definition.
Step 3. Add Data Set Definition to Report Definition
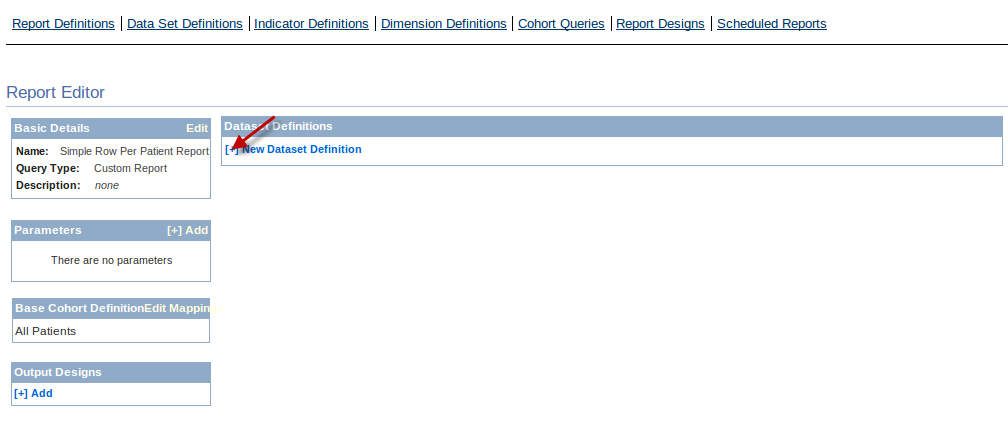
1 | In the Report Editor, click the plus sign under Data Set Definitions to add a new data set . |
|
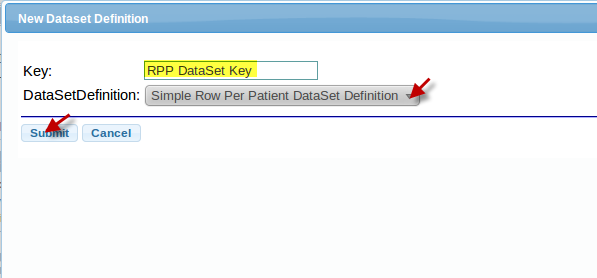
2 | In the 'Key', enter an appropriate label for your Data Set. A label will appear as , for example, the sheet name for your report in an Excel file. Here, we enter 'RPP DataSet Key'. Under 'Data Set Definition,' select the name of the data set you created in Step 1 (Simple Row Per Patient Data Set). Then click submit. |
|
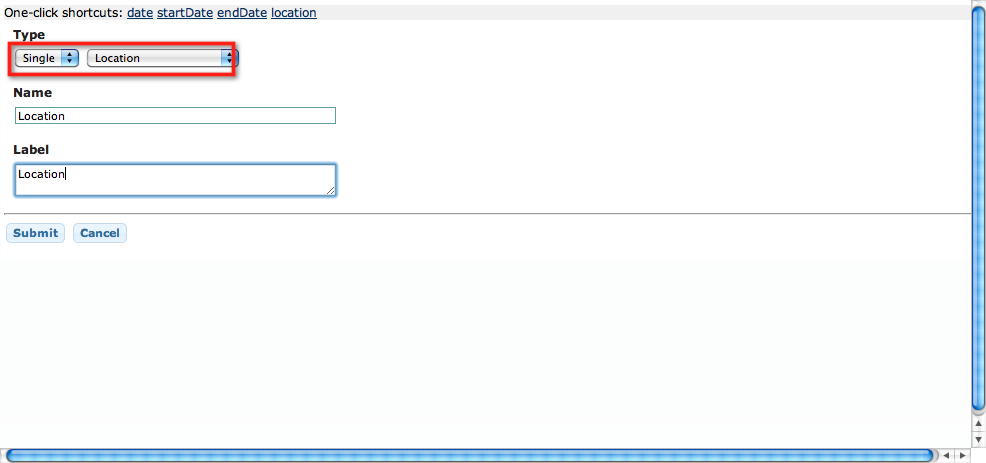
3 | In this stage, you may add parameters to the Report, such as Start Date, EndDate, and Location. Our report will list patients from a specific location, which we want to be able to change every time the program is run. We add a parameter 'Location' to enable this. Click the plus sign next to 'Add' under Parameters. Under 'New Parameter', because it is a single value, choose 'Single' under type, and choose 'Location' from the adjacent drop-down. Type a name under Name and an appropriate label, which will be displayed when the report is run, for your new parameter. Then click submit. |
|
| Your Simple Row-Per-Patient report is now complete. See Running Reports for information on how to run it. Following these steps, your report should look like the example to the right. |
|
Building Indicator Reports
Period Indicator Report Step-By-Step
This step-by-step tutorial will guide the user in making indicator reports, using a period indicator report as an example.
See Indicator Report Definition for details.
Create a report that only includes patients in the Heart Failure Program. The first question will be:
* Percentage of men whose main job is farming
Step 1. Build Cohorts
Step 2. Build Indicators
Step 3. Build Dimension
Step 4. Create Report
Step 1. Build Cohorts
1 | Click 'Administration' from the main toolbar. |
|
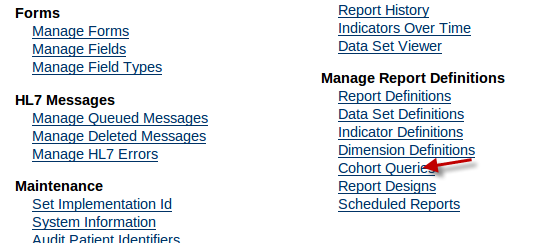
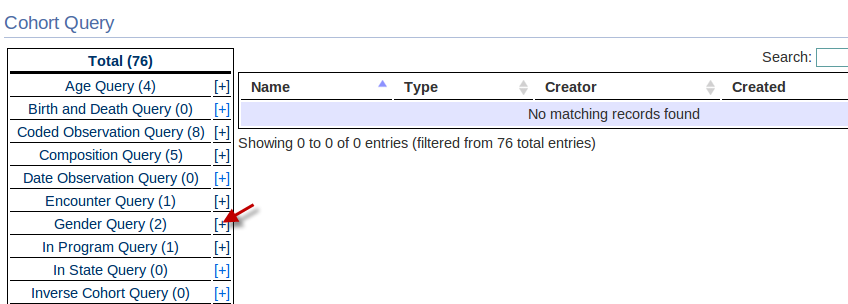
2 | Under 'Manage Report Definitions,' select 'Cohort Queries'. |
|
3 | Our first cohort will contain all male patients. Select 'Gender Query' by clicking the plus sign next to the cohort category. |
|
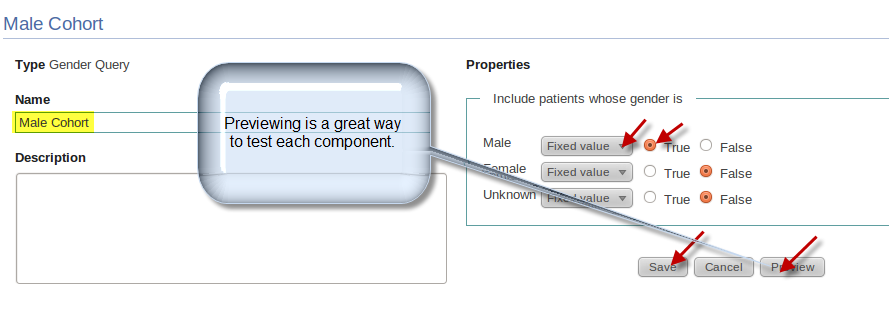
4 | Type the name of your cohort under 'Name.' In this case, we will name it 'Male Cohort'. You can type a more detailed description under 'Description'. |
|
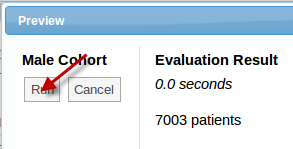
5 | We want to include only males in this cohort. As such, under 'Properties,' set the Male property to be 'True' and a fixed value. If you want to decide whether to include males or not each time you run your report, you can set this as a parameter. We do not want to include females or patients of unknown gender in the report, so check 'False'. Click 'Save.' |
|
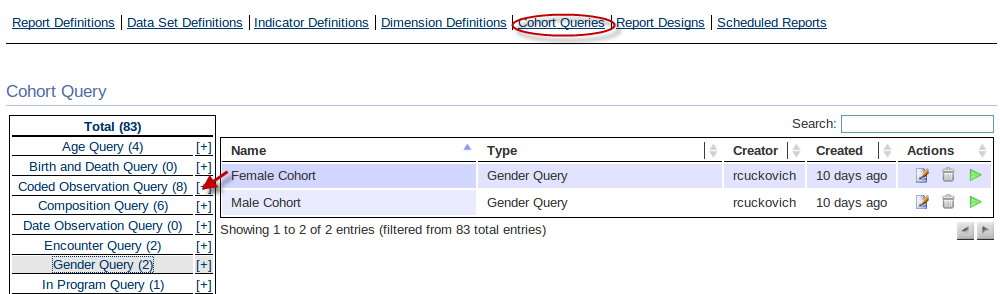
6 | We will now build our second cohort, 'Farmers', which will contain all the patients whose main occupation is farming. Go back to the 'Cohort Query' page by clicking the 'Cohort Queries' link on the toolbar above. |
|
7 | This type of query is a 'Coded Observation Query.' Click the plus sign next to the 'Coded Observation Query' to create the Farmers cohort. |
|
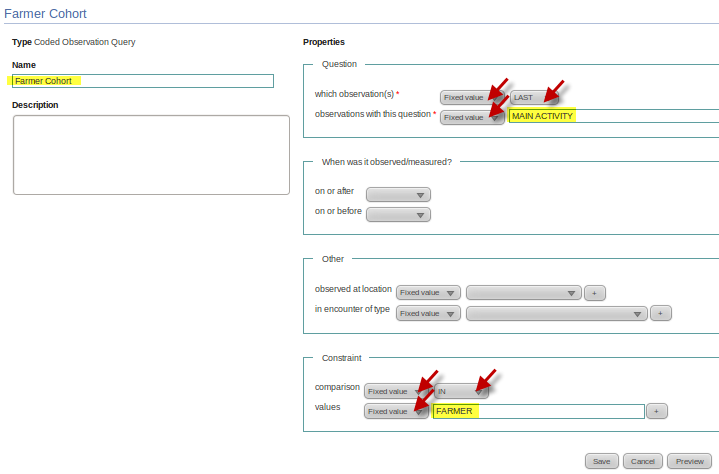
8 | Type 'Farmer Cohort' under name, and under properties, add in the observation 'MAIN ACTIVITY.' This is a fixed value, as you do not want to change the observation each time you run the report. Also, set the type of observation to 'Last' to take only the latest occupation of the patients into account. Under 'Constraint', set the comparison to a fixed value, the comparison to 'IN,' and the value to compare against to 'Farmer.' This sets the observation of 'Main activity' to the value 'Farmer.' All of these fields are fixed values because we do not want the choice of changing what the cohort contains each time the report is run. |
|
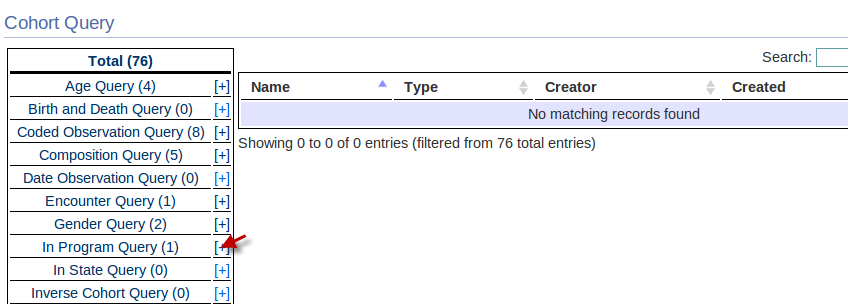
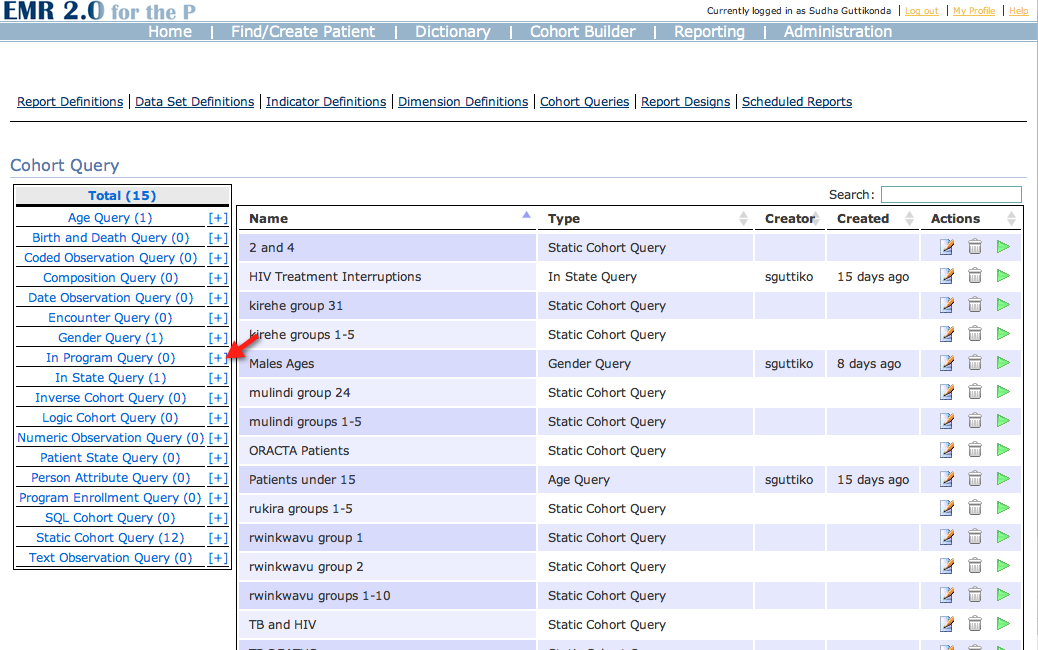
9 | We will now create our final cohort for this report, the 'In Heart Failure Program Cohort', which will contain all patients who are in the Heart Failure Program on a specific date. Go back to the 'Cohort Query' page and click the plus sign next to 'In Program Query'. |
|
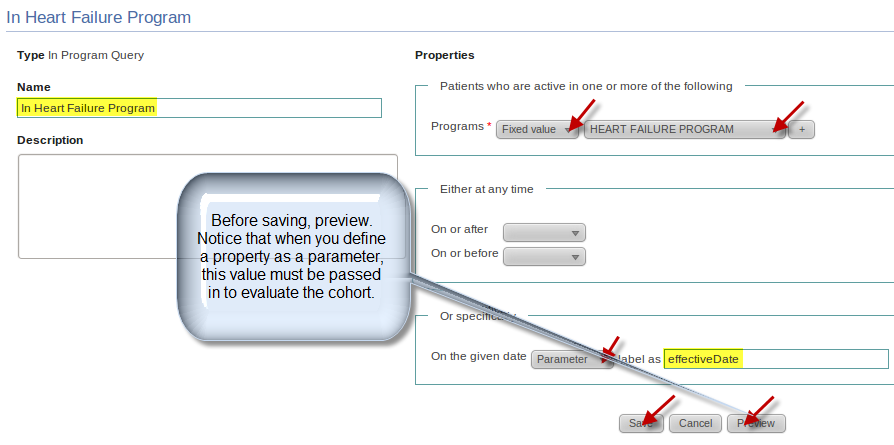
10 | Under 'Name', type 'In Heart Failure Program.' Under 'Properties', set Programs to a fixed value and the 'Heart Failure Program.' Under 'Or Specifically', since we want to check the patients in the heart failure program on a specific date, set the property as a Parameter, as we may change the date each time we run the program, and the label as 'effectiveDate.' Then click 'Save'. |
|

You are now ready to build an Indicator.
Step 2. Build Indicators
We will now build the 'Farmers Indicator', which will return the percent of farmers in the Heart Failure Program at the report 'End Date' and in a specific location.
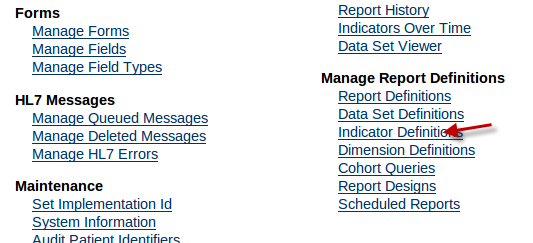
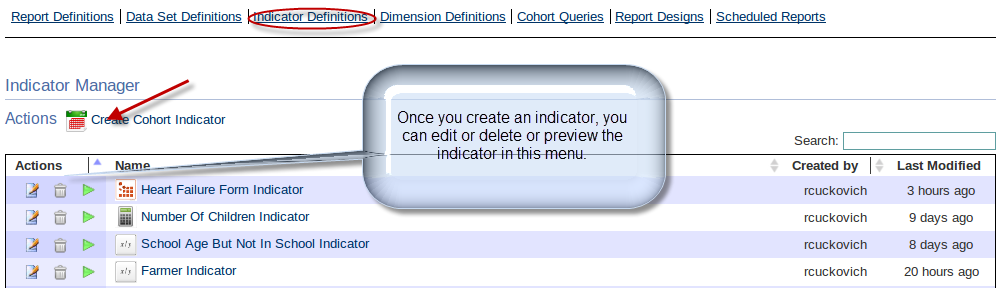
1 | Under 'Administration', click 'Indicator Definitions'. |
|
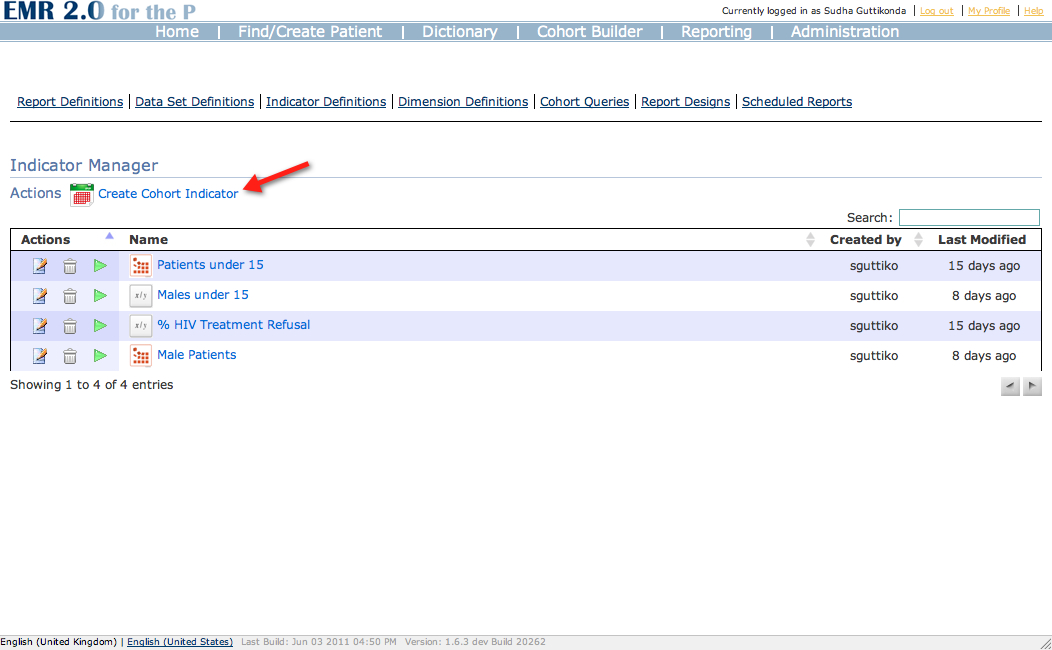
2 | Under 'Indicator Manager', click 'Create Cohort Indicator' to create a new indicator. |
|
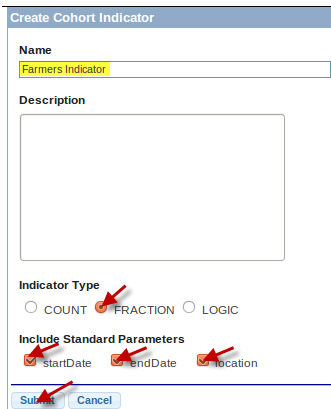
3 | Under 'Name' time in 'Farmers Indicator.' Under 'Type', select 'Fraction', since this indicator will show the percent of farmers in the heart failure program. The 'Count' type will return the number of individuals in a cohort, and the 'Logic' type will allow you to perform other aggregate functions such as mean, median, etc. |
|
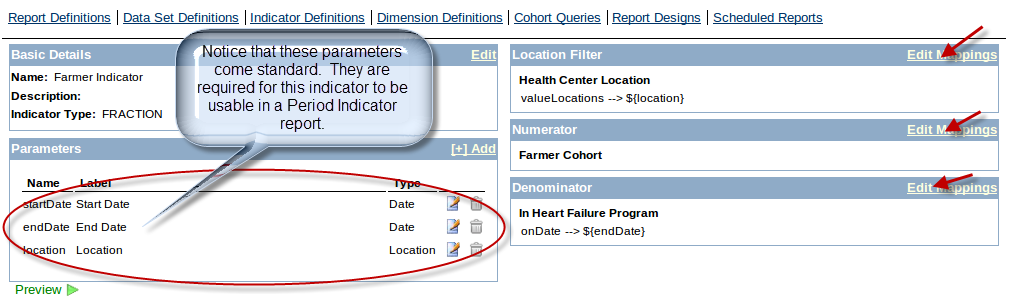
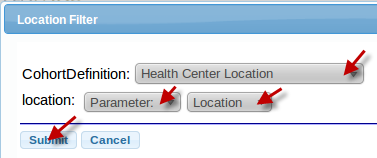
4 | For the 'Location Filter', click edit mappings to set it to 'Health Center Location.' Set it to a parameter, and of type 'Location.' Now, the indicator is restricted to a health center location which will be passed in at the run of the report. |
|
5 | For the 'Numerator', click edit mappings, and choose 'Farmer Cohort' for CohortDefinition. |
|
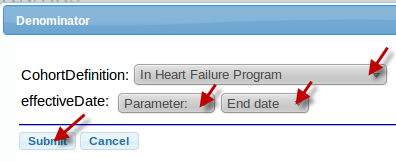
6 | For the 'Denominator', click edit mappings, and choose 'In Heart Failure Program'. Note that the numerator is automatically constrained by the denominator, so only farmers in the Heart Failure Program will be aggregated in the numerator since 'In Heart Failure Program' is the definition of the denominator. |
|
You are now ready to build a Dimension.
Step 3. Build Dimension
We will now create a dimension to restrict the Farmers Indicators to only males.
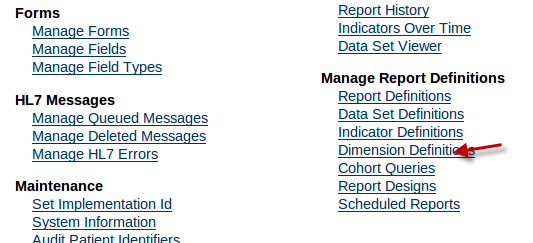
1 | Under 'Administration' and 'Manage Report Definitions', click 'Dimension Definitions'. |
|
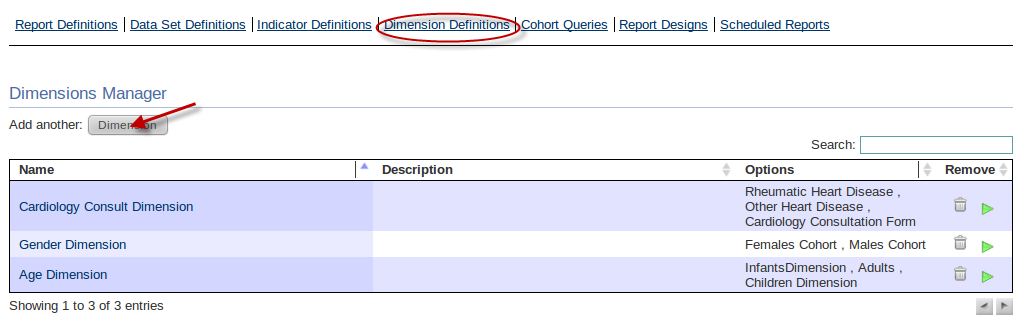
2 | Under 'Dimensions Manager', click 'Dimension' to add a new dimension. |
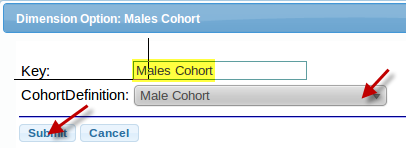
|
3 | Under 'Dimension Option', create a label under Key. In this case, we will make it 'Males Cohort', and the CohortDefinition will be Male Cohort. |
|
Step 4. Create Report
We will now create the final Period Indicator Report.
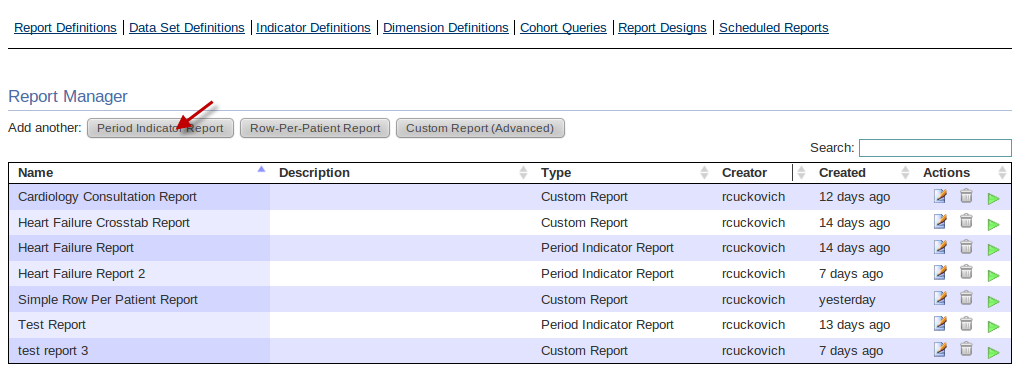
1 | Under 'Administration' and 'Manage Report Definitions', click 'Report Definitions'. |
|
2 | Under 'Report Manager', select 'Period Indicator Report' to add another Period Indicator Report. |
|
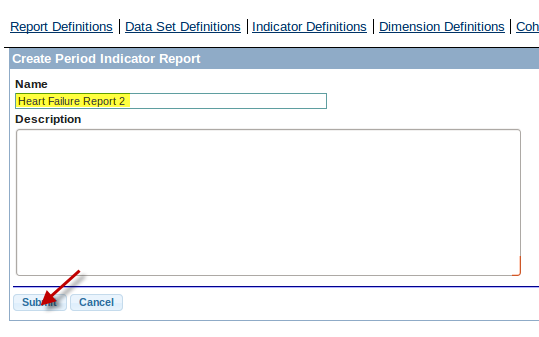
3 | Under 'Name', enter 'Heart Failure Report'. You can enter a more detailed description under 'Description'. Then click 'Submit'. |
|
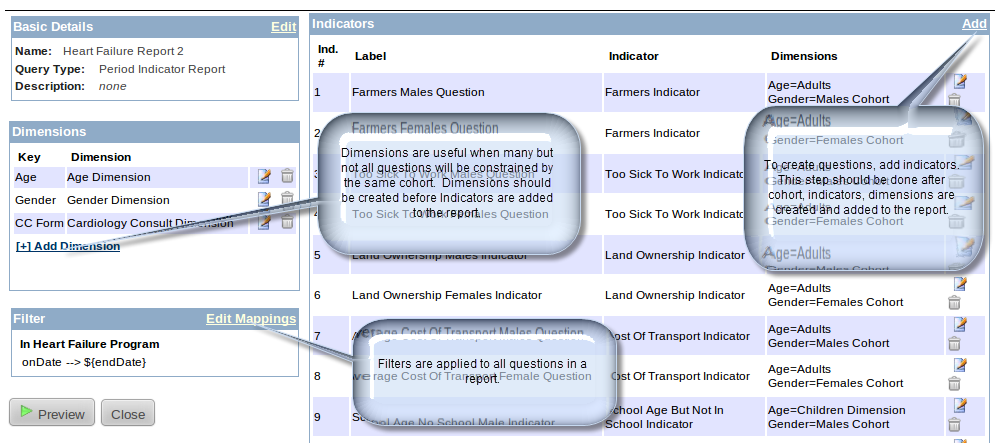
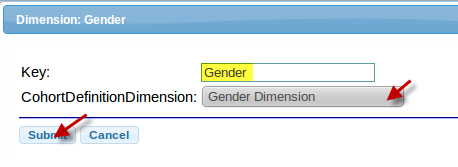
4 | Under 'Dimensions', select 'Add Dimension'. For the key, enter the label 'Gender' and the CohortDefinitionDimension as a 'Gender Dimension'. When you add your first question to the report, you will be prompted to enter the specific cohort that will act as the dimension, but until then, it suffices to enter the type of this cohort. |
|
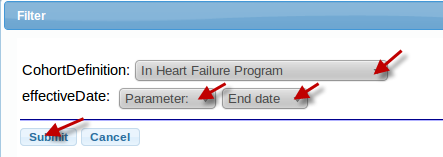
5 | Under 'Filter', select 'Edit mappings' and enter 'In Heart Failure Program' as the CohortDefinition and the effectiveDate as a parameter and the 'End date'. This will ensure that no patient that is not in the Heart Failure Program ends up in the report. |
|
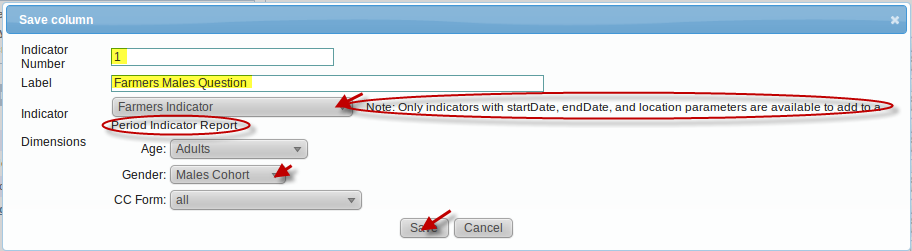
6 | Now you are ready to add your first question. Under 'Indicators', select 'Add'. Type the Number of the question in the 'Indicator Number'. Enter the question itself under 'Label': Percent of Male Farmers in Heart Failure Program. |
|
Your Period Indicator Report is now complete. To run it, see Running Reports.
Custom Cohort Indicator Report Step-By-Step
This step-by-step tutorial will guide the user in the creation of a custom Indicator Report, using a Cohort Indicator with Dimensions Report as an example. This example will highlight how parameters are used in reports. See Understanding Parameters and Indicator Report Definition for details.
The first question in this report will be:
* Number of People in the HIV Program at the endDate
Step 1. Build Cohort
Step 2. Build Indicator
Step 3. Build Data Set Definition
Step 4. Create Report
Step 1. Build Cohorts
We will now make our cohort, InProgramOnDate, which will contain patients in a specific program by the end date of our report.
1 | On the Cohort Query main page (see Step 1 of Building a Period Indicator Report), add a new 'In Program Query' cohort by clicking the plus sign next to the link. |
|
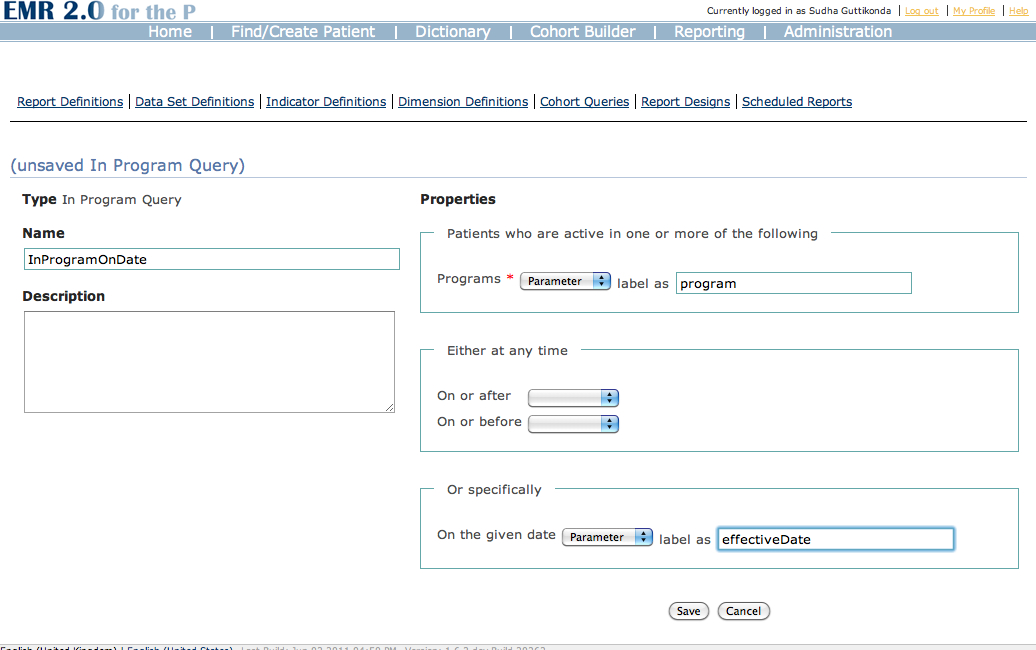
2 | Under 'Name', enter 'InProgramOnDate'. You can enter a more detailed description under 'Description'. Under 'Properties', add a program as a parameter. This will allow us to choose which program to select for every time we run the report. Under 'Or specifically', enter effectiveDate as the label and also set it to a parameter, so that we can select the date each time the report is run as well. Save the cohort. |
|
You are now ready to create an Indicator.
Step 2. Build Indicators
1 | Under 'Indicator Definitions' from the toolbar above, select create new Cohort Indicator (see Step 2 of Building a Period Indicator Report). |
|
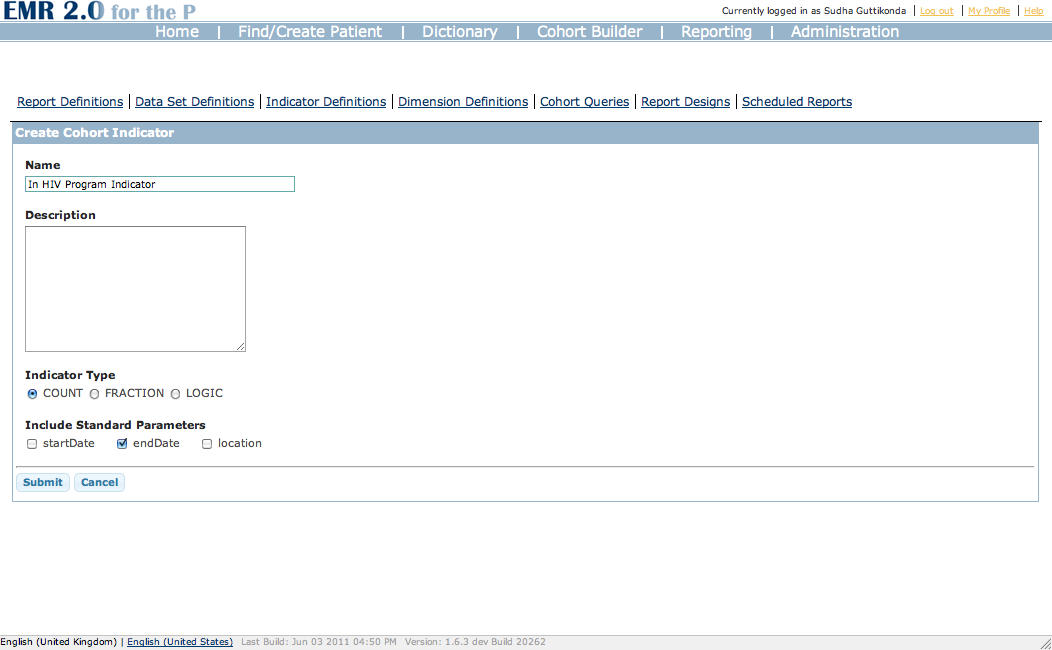
2 | Under 'Name', input 'In HIV Program Indicator', and select the type to Count, as the aggregate function will be counting the number of patients in the HIV Program. Also, include the standard parameter 'endDate', since we want to know how many patients are in this particular program on this particular date, to be set each time the report is run. Click 'Submit'. |
|
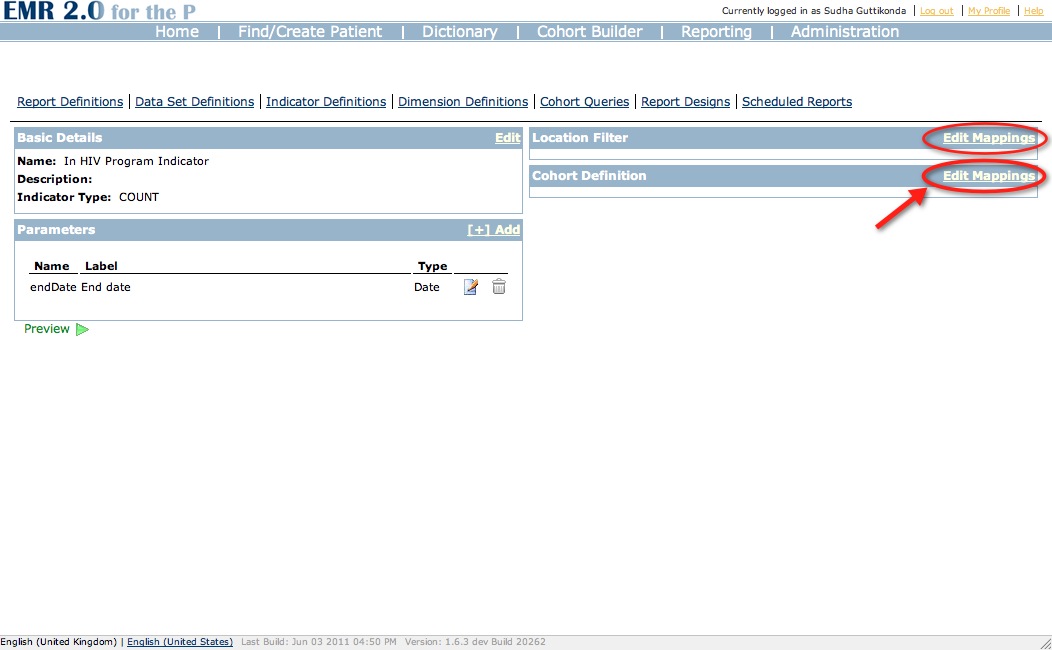
3 | Under 'Parameters', add the parameter 'endDate' so that it can be passed in. Under 'Cohort Definition', click 'Edit Mappings' to add in the InProgramOnDate Cohort. |
|
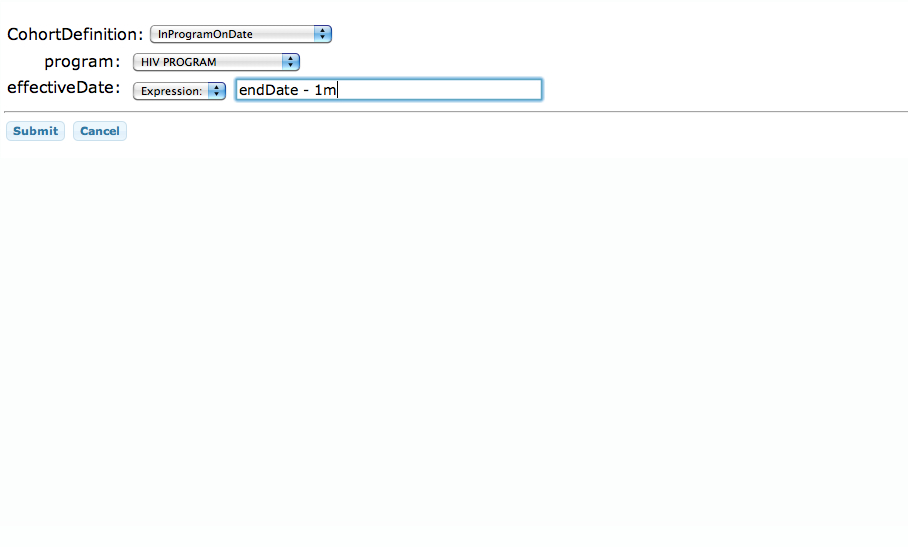
4 | In the Cohort Definition dialog, choose 'InProgramOnDate' as the Cohort Definition. Add 'Adult HIV Program' as the program, which is then passed in to the InProgramOnDate program parameter. Set the effectiveDate parameter to an 'Expression' – endDate – 1m, to represent one month before the endDate that will be entered when the program is run. |
|
You are now ready to build your data set definition.
Step 3. Build Data Set Definitions
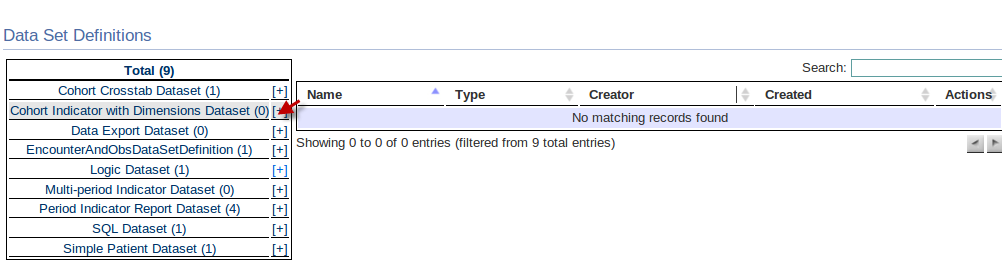
1 | Click 'Data Set Definitions' on the toolbar above. On the Data Set Definitions page, click the plus sign on the Cohort Indicator with Dimensions Data Set' link to add a new data set. |
|
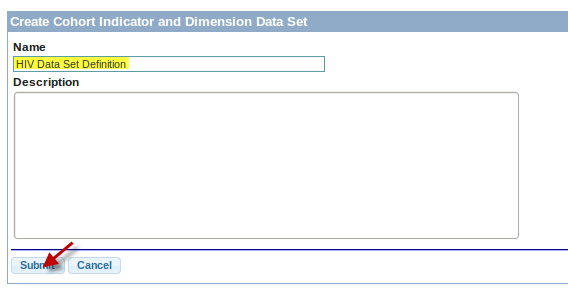
2 | Under 'Name', type 'HIV Data Set Definition'. You can enter a more detailed description under 'Description'. |
|
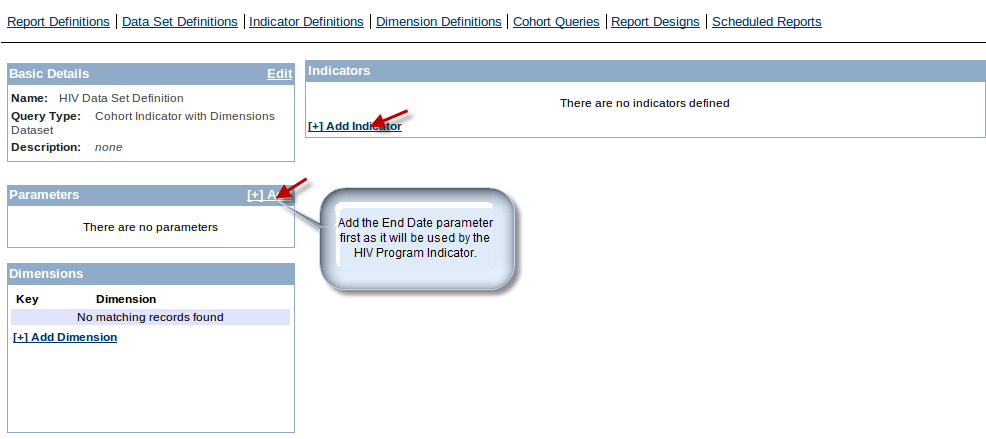
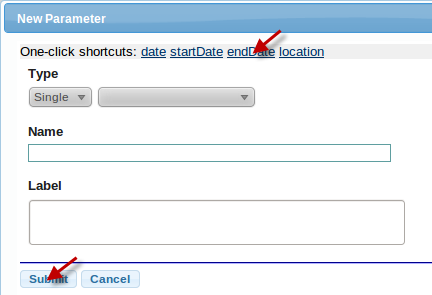
3 | Under 'Parameters', click Add to add the end date parameter. In the New Parameter dialog, click the 'endDate' shortcut link to automatically add it without setting the type. Click Submit. |
|
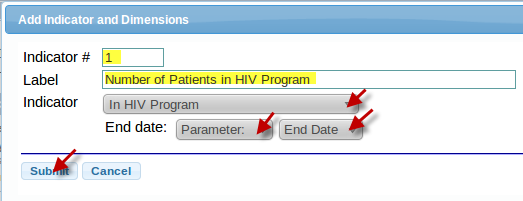
4 | Under 'Indicators', add a new Indicator '#1' with a label, and use the In HIV Program Indicator you built earlier. Add the Parameter End Date. Click Submit. |
|

You are now ready to build your custom Indicator Report.
Step 4. Build Custom Indicator Report
1 | Under 'Report Definitions', click 'Custom Report (Advanced)'. |
|
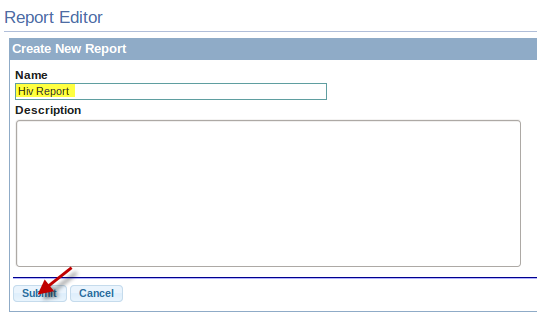
2 | Under 'Name', enter 'HIV Report'. You can include a more detailed description under 'Description'. Click 'Submit'. |
|
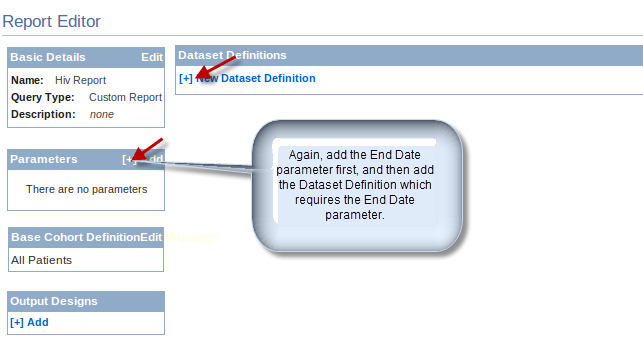
3 | Under 'Parameters', add the endDate parameter as you did when you built your data set. |
|
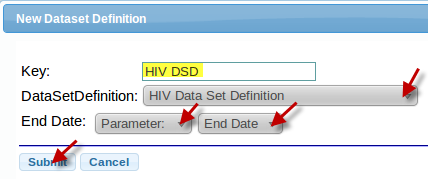
4 | Under 'Data Set Definitions', add the new Data Set with a label under key and the HIV Data Set Definition from the drop down. Also, add the parameter “End Date”. |
|

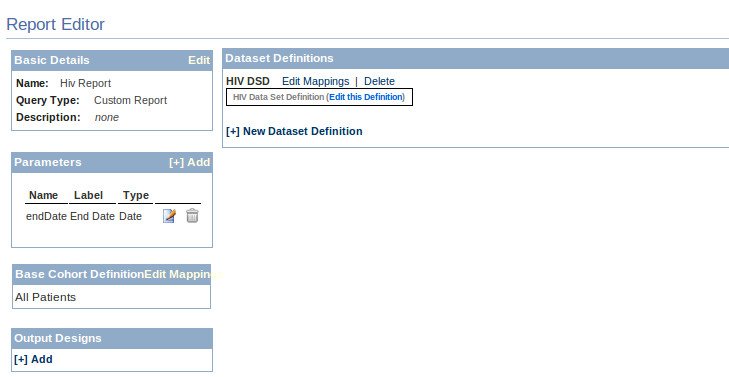
Your Custom Indicator report is now complete. For information on running this report, see Running a Custom Indicator Report.
Screen Casts Step-By-Step
To help get you started with the Reporting Module, we have put together a few screen casts.
- How to define a new Simple Report
- How to define a new Cohort Query with a parameter
- How to define a new Cohort Indicator (and map it to the underlying Cohort Query)
- How to break indicators down by dimensions like sex and age
Additional tips
startDate and endDate
When building mysql data sets, the startDate and endDate parameters use a time of 00:00:00. Consider this when building a data set. If the time period is January 1, 2012 thru January 31, 2012, the user enters those as start and endDate parameters. The mysql will need to add 1 date to endDate to include that last day's data.
select o.value_text
from obs o, encounter e
where o.obs_datetime >= :startDate
 and o.obs_datetime < addDate(:endDate,1)
 and e.location_id = :location
 and o.encounter_id = e.encounter_id
 and e.encounter_type = 13
 and o.concept_id = 6541
 and o.voided = 0
 and e.voided = 0
from obs o, encounter e