Using the PatientMatching Web Interface
Introduction
The PatientMatching module can be used either as a standalone jar or as an omod file loaded into the web interface.
The standalone jar lets users compare two datasources or flat files, while the web interface lets users work specifically with the OpenMRS database.
Note worthy changes in the web interface include,
1. Limited provision for user interaction. users are not allowed to take full benefit of some of the module functionality which is available via the standalone.
2. The Web interface does not let you compare two datasources, instead you must work on one specific OpenMRS database
3. The web interface method is low in complexity and easier to use.
Sample run using the web interface.
1. Load the OpenMRS standalone jar into OpenMRS
2. Create one or several matching strategies to process patient records.
To create a new strategy, go to the admin page, click on 'manage strategies', and then 'create new strategy'. Now, select one or more 'must match' and should match' columns for your strategy. At bare minimum, each strategy requires at least one 'must match' and one 'should match' column.
Enter a suitable name for the strategy, and save it. 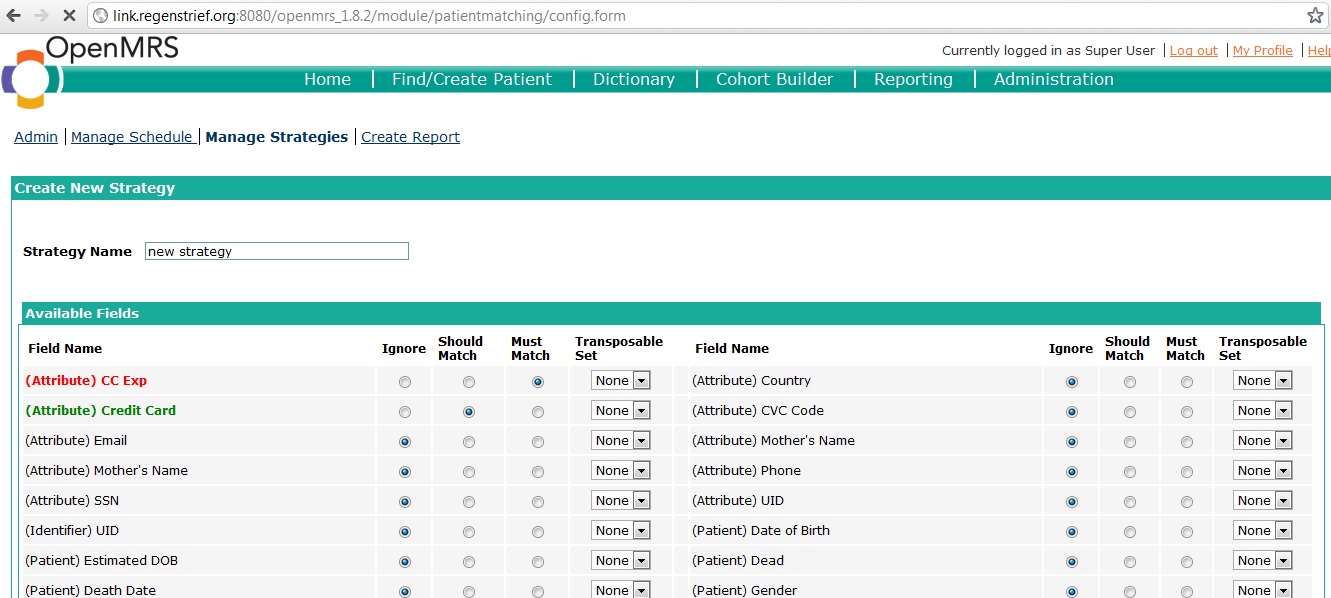
To ensure optimal performance, its encouraged to create two or more strategies, each which block in a meaningfull manner.
Once the stratefies have been created, you may generate the Report.
to do so, navigate to the create report page. This page appaears as follows, 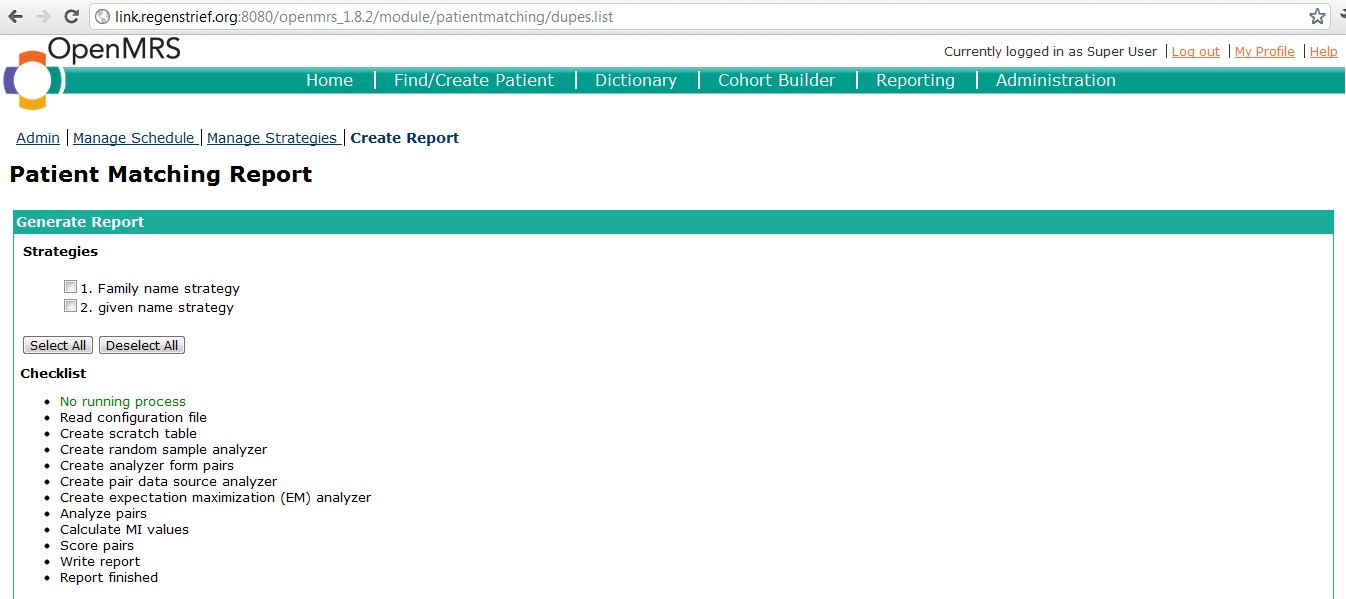
As you can see, all user defined strategies are listed on this page. To generate a report, users must select one or several strategies and click on the generate button.
Report generation time varies based on the size of data to be processed. The most time is spent on the 'create scratch table' process (see web page image attached above). Roughtly, a database with 150,000 patients may take 1-2 hours to process.
Once the report is completed, results can be accessed via a link displayed on the bottom of the page. A sample report may look as follows, 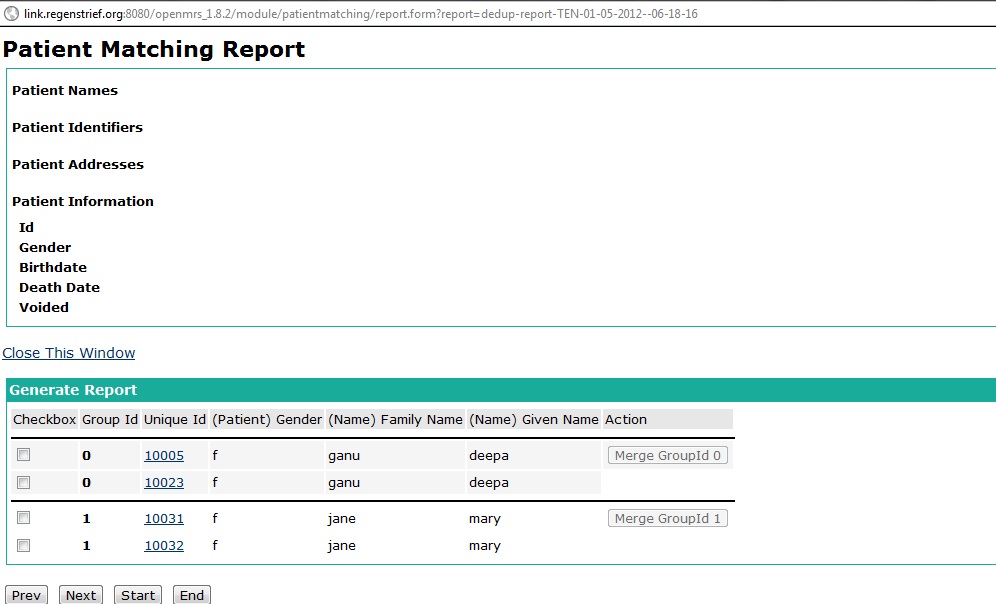
Lets try to decipher what this data means.
Note that the retrieved data has been grouped into two subsets.
This means that the report has calculated that the two patient records displayed under group_id 0 may be duplicates or each other, while those displayed under the group_id 1 may also be duplicates of each other. In this case, each grouping consist of two patient records. However, this is not a must, and may increase to any number.
The user can now review these results, and manually select which records to merge or not. He can merge by ticking on the check-box in front of each record, and then clicking on the enabled 'Merge Group Id' button.
The patient matching reports are currently stored as xml files. Therefore, completed reports may be viewed and merged at leisure.