Render a Report Into a Custom Excel File
One of the Report Renderers that ships with the reporting module provides the capability of rendering the report into a custom created Excel template. This is often useful for presenting reports in a prescribed format to a reporting agency and allows graphs, formulas, and other calculations to add richness to your report.
The following screen shots are as a guide through the process. The following example uses a Period Indicator Report.
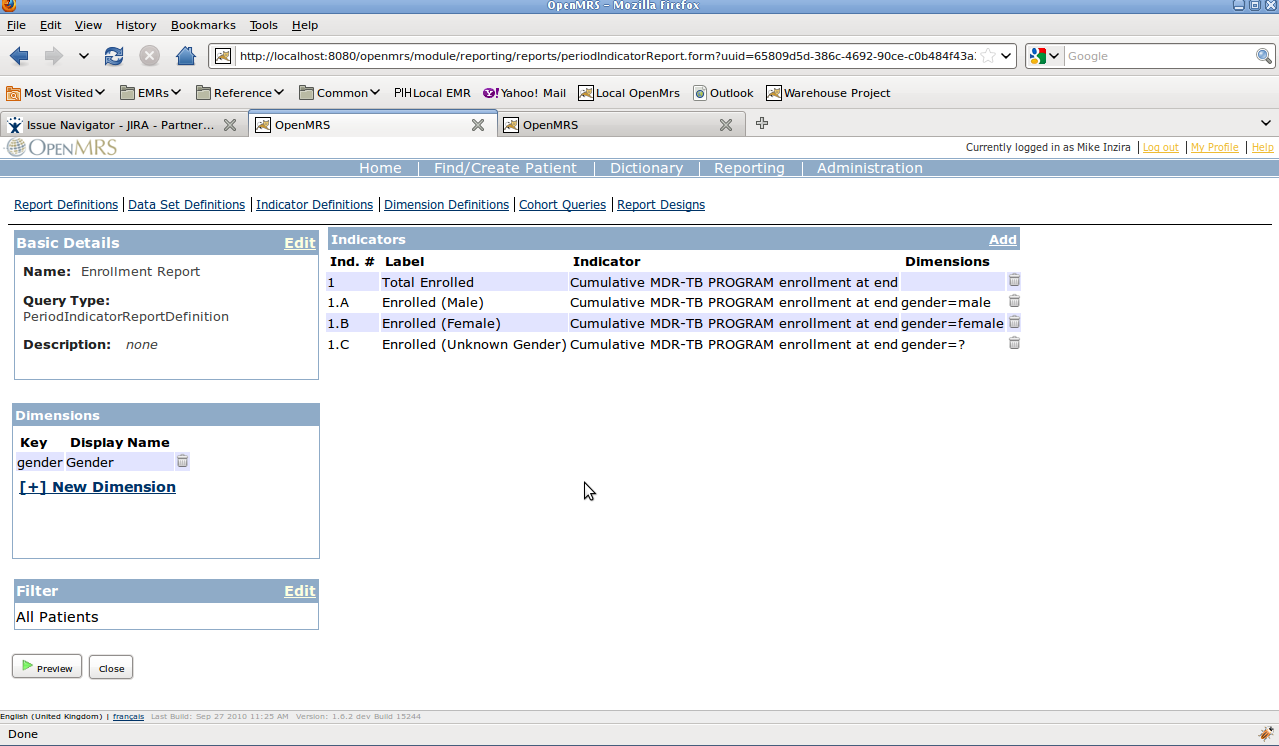
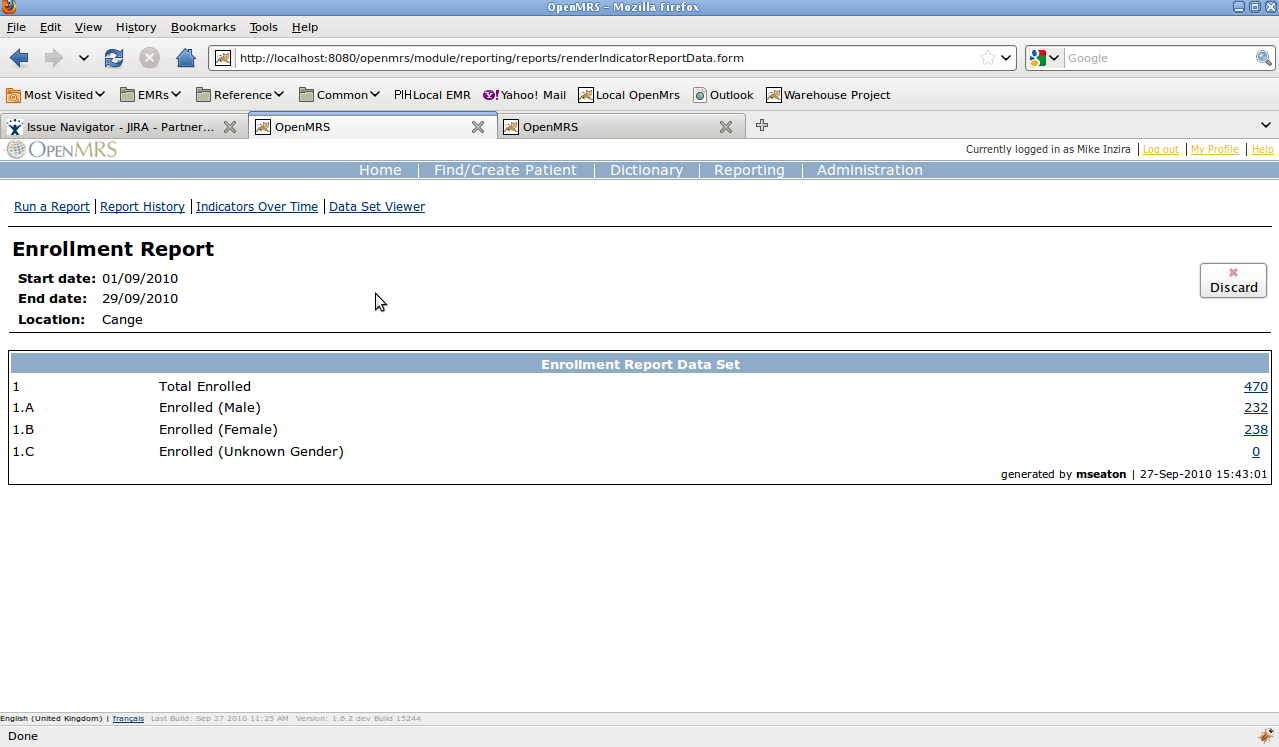
1. Define Period Indicator Report. Make note of the numbers that you give to each indicator in the report. To the right, you will see that we have created a sample report with indicators numbered 1, 1.A, 1.B, and 1.C. Running this report with the default "Indicator Web Report" view, confirms that this report runs and produces correct numbers for each of our our numbered indicators. |
|
|
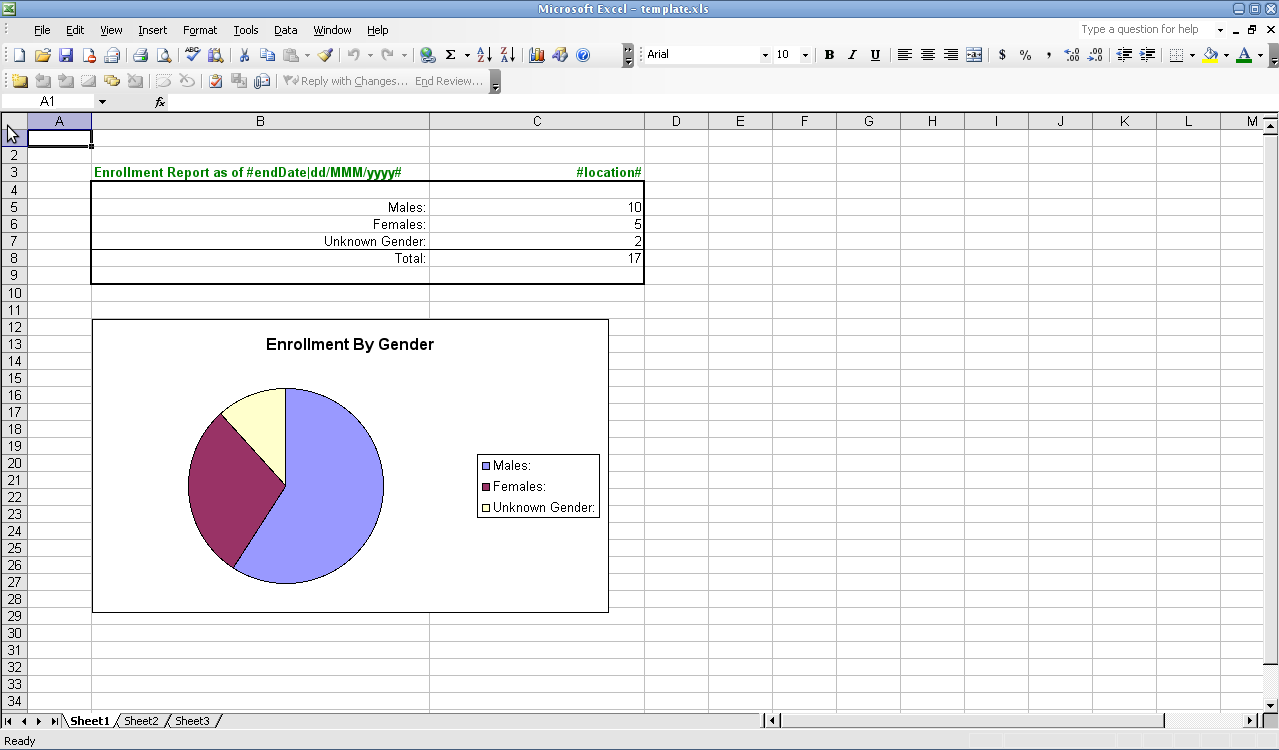
2. After the report is configured and the names of each of your parameters and numbers of each of your indicators are defined, you can build the Excel-based template. This involves a couple of steps. In the first image to the right, we have used sample numbers to create the report in Excel in exactly the format in which we want it to appear. We incorporate fonts, colors, borders, calculations, and even graphs which are calculated off our or indicator numbers when generated. |
|
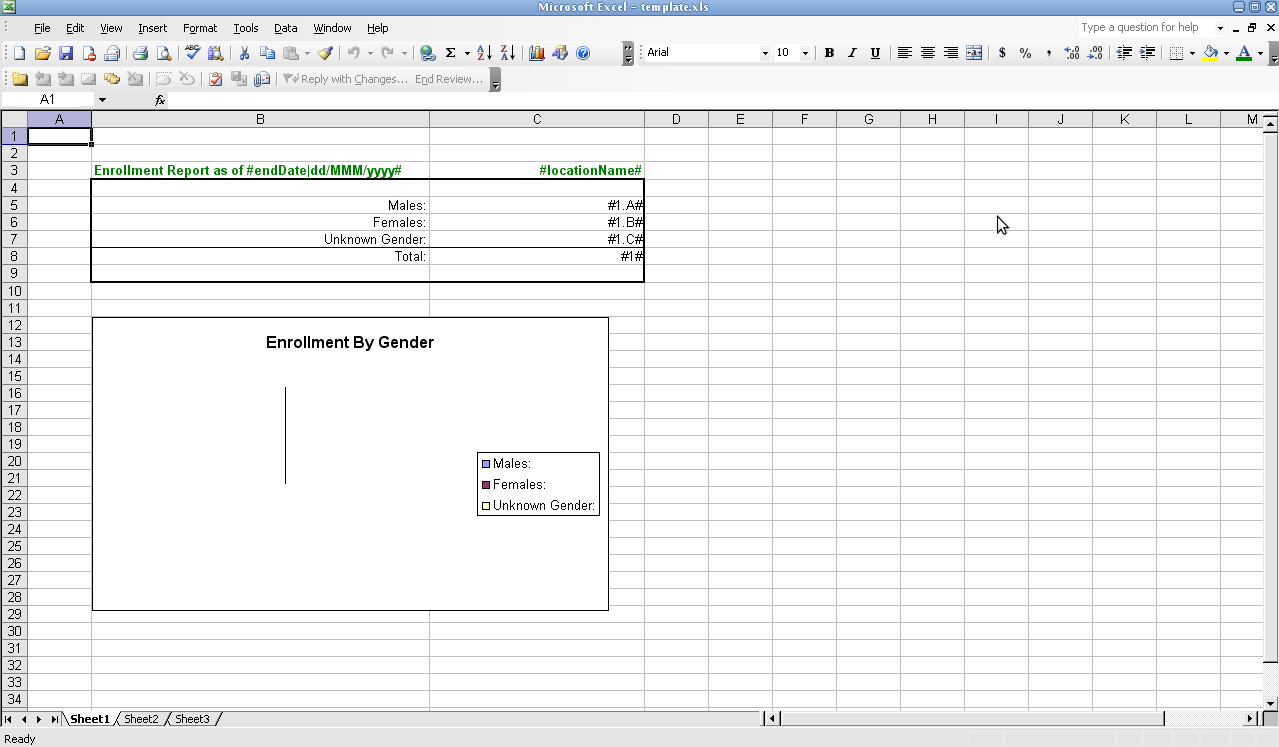
3. Next, we replace each of the numbers which need to be produced by the report with references to our indicator numbers. These are referenced by #1#, #1.A#, #1.B#, and #1.C#. You will see that we can also refer to our parameters - in this case #parameter.endDate|dd/MMM/yyyy# means to display the value of the endDate parameter in a dd/MMM/yyyy format. #parameter.location# means to display the value of the location parameter (*see below for full list of available replacement values*). Note that the graph doesn't look so nice in this view - since we took away the sample numbers that it is based on, and replaced these with the indicator references, the graph breaks. This is not a problem - it will generate correctly when run. Save the excel file as xls (not xlsx). |
|
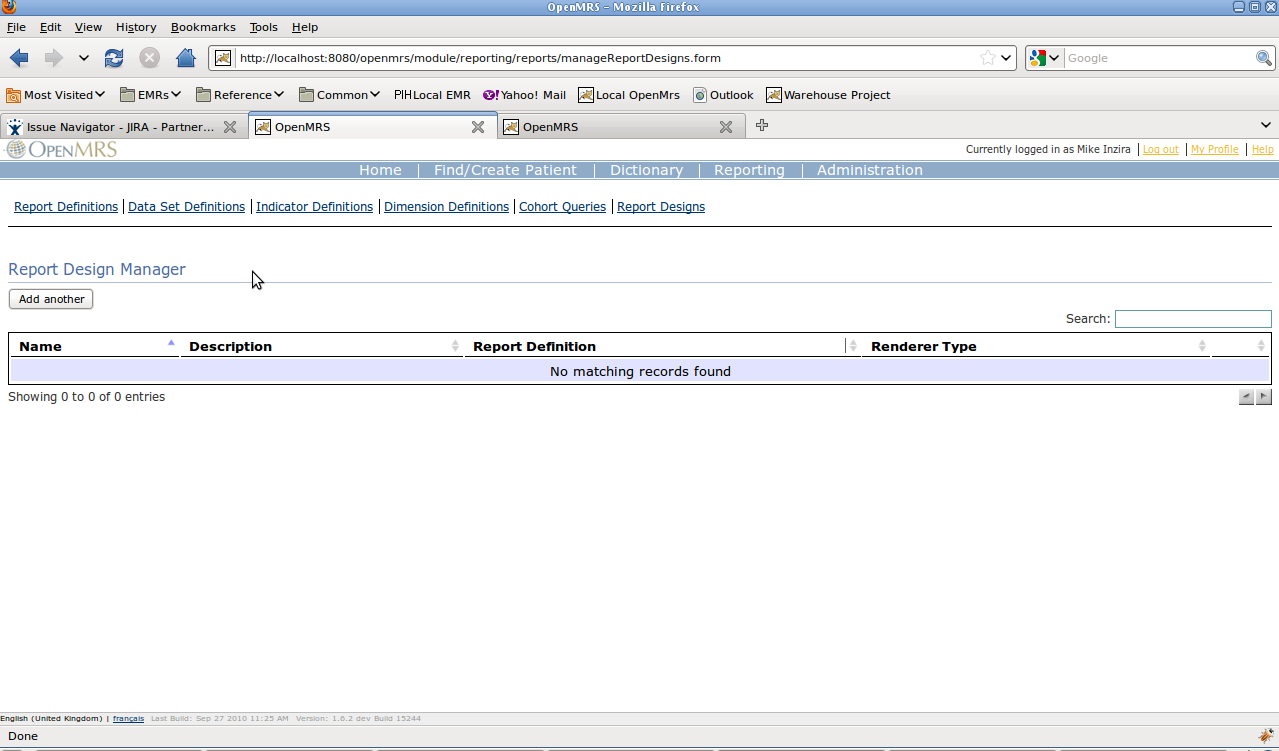
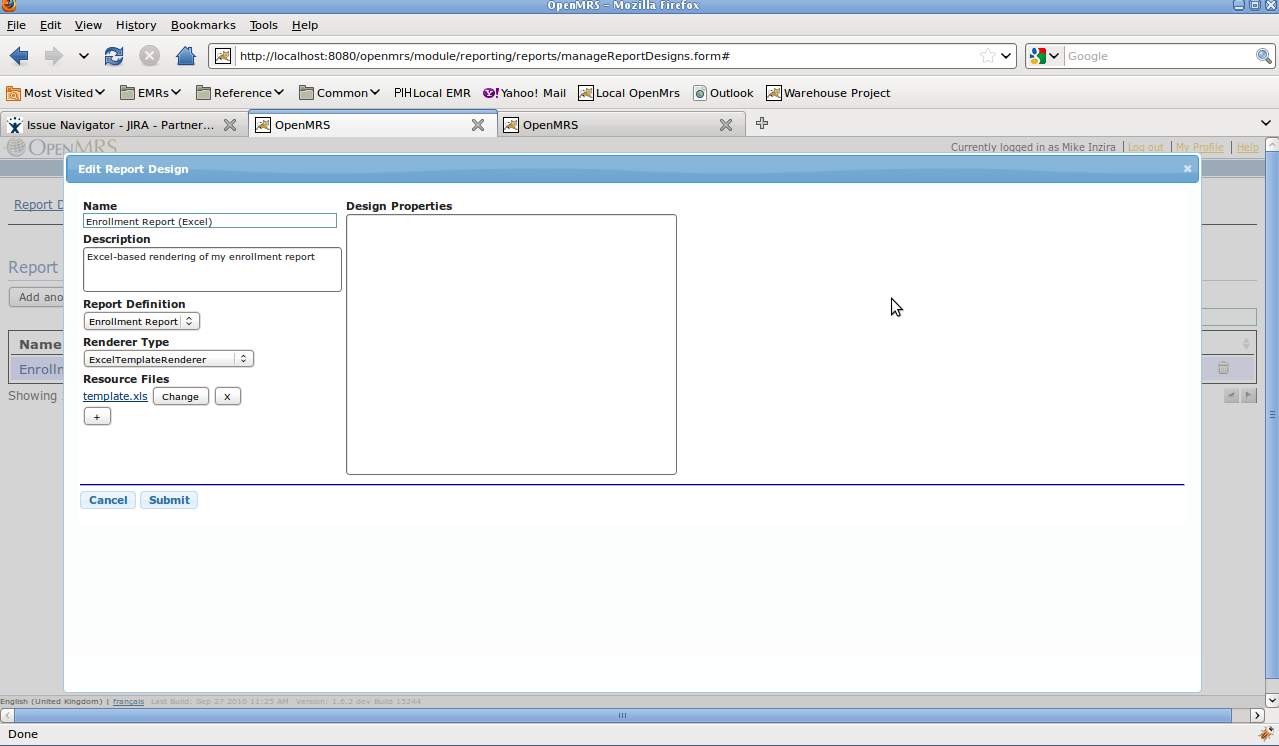
4. In Report Designs, click on "Add Another" and you will get a dialog pop-up which will enable you to upload your design as seen in the first image to the right. The fields should be completed as follows:
|
|
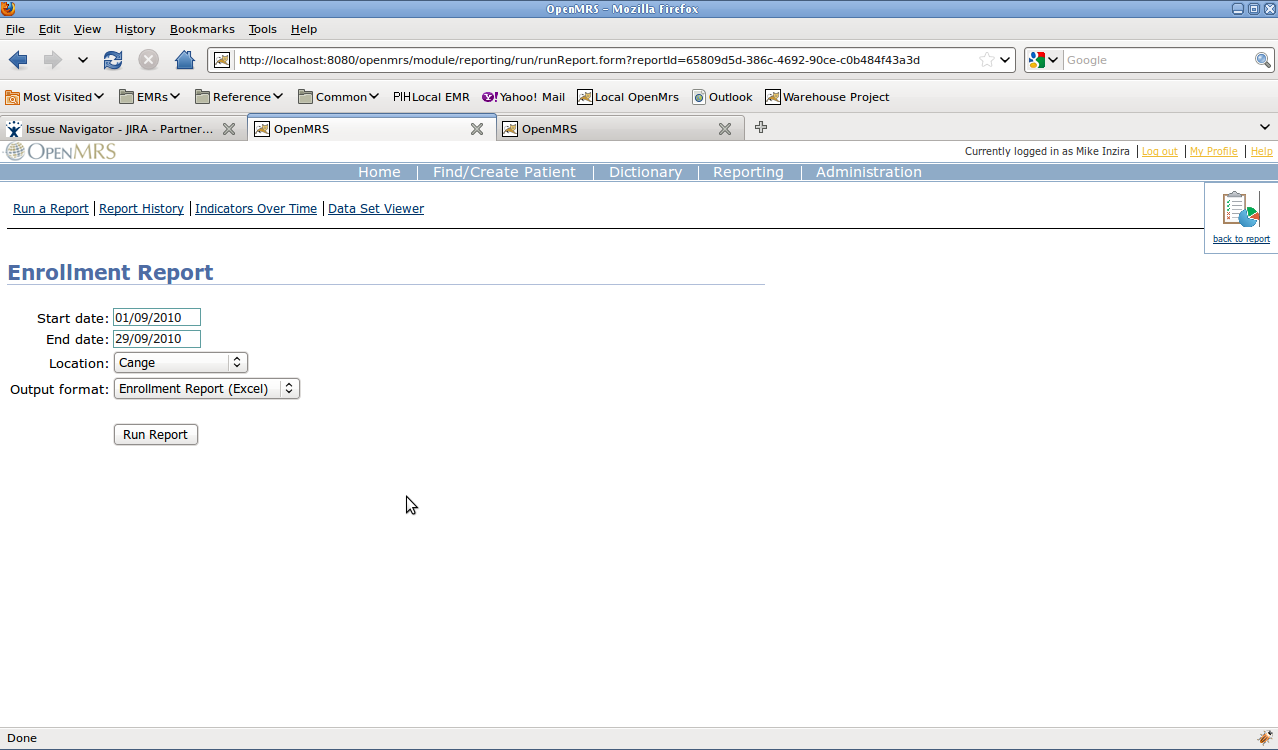
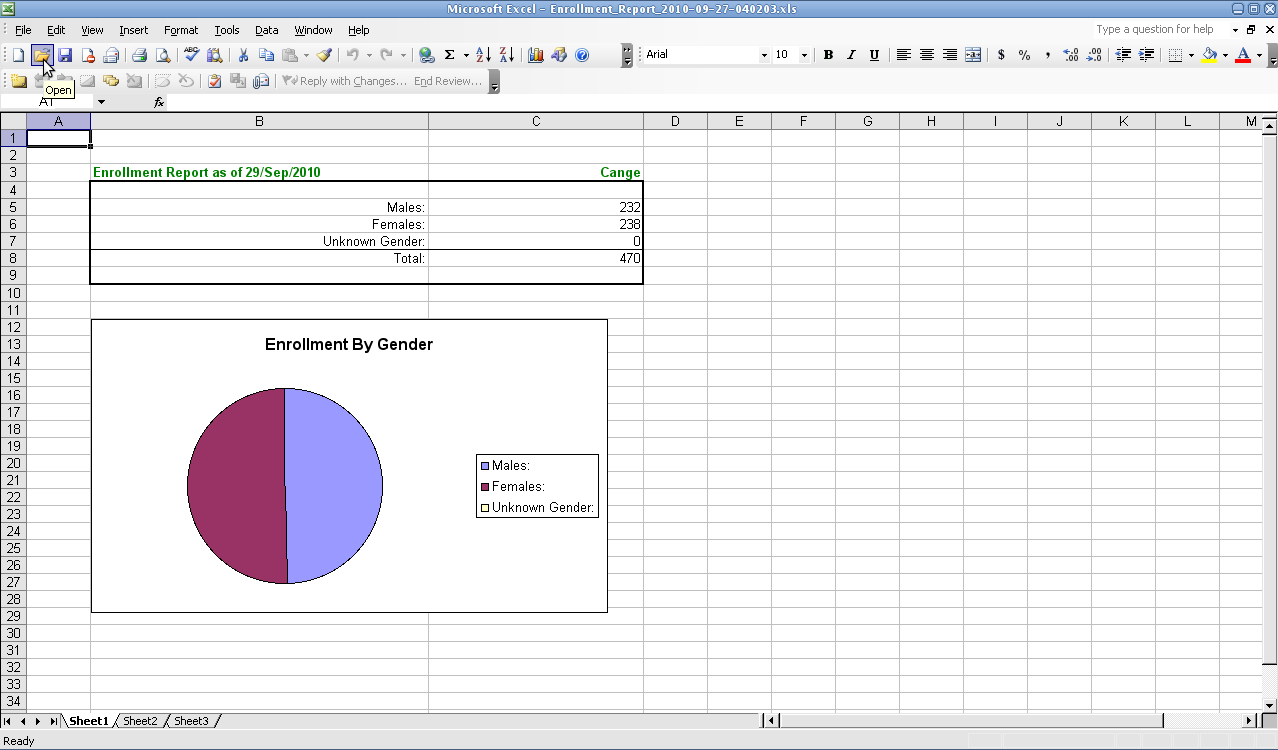
5. Return to Run a Report. Choose the newly created report. The Excel template that was uploaded is available in the list of "Output Formats". Running the report and choosing this format should produce an Excel Report output like the one shown to the right. |
|
|
Special hints for row-per-domain
If you want to show multiple rows on the final Excel spreadsheet, define the location in the Excel template file in the cells where you want the data to appear, along with Repeating Sections information of the renderer configuration screen. The report renderers now include a graphical interface for entering the repeating sections information. If using an Excel Report Renderer, note that you must select "Use a custom Excel output, based on a template workbook" for the fields to be shown. Example:If you have a dataset added to the report with the "key" of "rowPerReceptionEncounter", and with dataset columns named "receiptNum" and "paymentType". You want the Excel document to start outputting these on line 5 of the first workbook of your Excel document in columns 2 and 3 of these rows. Do the following 2 things:
| 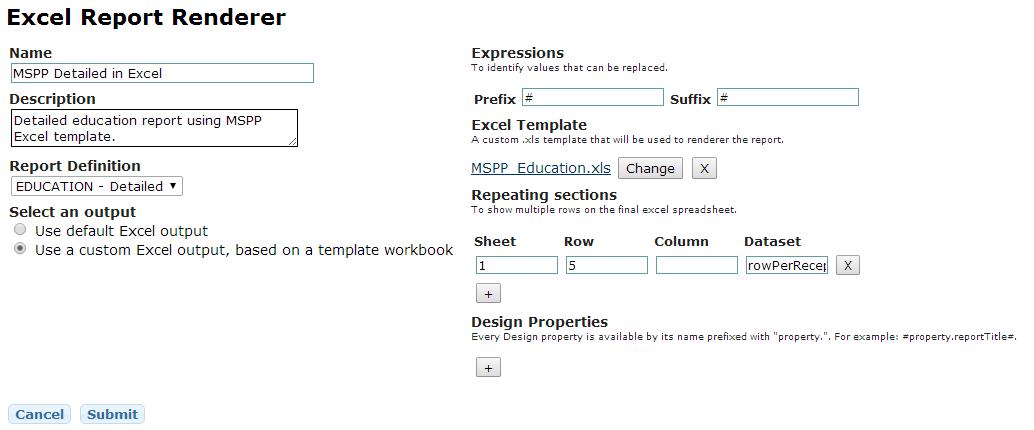 |
In the past, it was necessary to structure your repeating sections in a text area called "Design Properties" according to this format.
repeatingSections=
sheet:[number} where the number is the order of the worksheet on the excel template.  Do not use the name of the worksheet. (ie. sheet:1)
row:[number] where the number is the starting row on the excel worksheet where the data should be added
dataset:[dataSetName] where the dataSetName is the name used in the report
You can handle "row-per-xyz", "row-per-encounter", etc. datasets that have a variable number of rows by setting some properties on the ReportDesign. Add a property called "repeatingSections", where each "section" you want to repeat is separated by a "pipe" and contains a bunch of comma-separated attributes like this:
repeatingSections=sheet:1,row:12,dataset:someDataSet|sheet:2,row:3,dataset:nonNumerics
This tells the renderer to repeat every row in the dataset that the report knows as "allPatients", using rows 6-8 in sheet #1 as a template (you will end up with lots of rows)
sheet:1,row:6-8,dataset:allPatients
This tells the renderer to repeat every row in the dataset that the report knows as "malePatients", using column #4 in sheet #2 as a template (you will end up with lots of columns)
sheet:2,column:4:dataset:malePatients
This tells the renderer to repeat every row in the dataset that the report knows as "femalePatients" using sheet #3 as a template (you will end up with lots of sheets):
sheet:3,dataset:femalePatients
Available replacement values
- Indicator Values
- Only one DataSetDefinition: If the report contains only a single DataSetDefinition (i.e. PeriodIndicatorReports), indicator values can be accessed via it's indicator number. For example, #1.A#.
- *Multiple DataSetDefinitions: *If the report contains multiple DataSetDefinitions, indicator values must be prefixed with the DataSetDefinition name. For example, #firstDataSet.1.A#
- Number of Digits After Decimal Point (Especially useful when used with text templates): Since Reporting 0.7.2.2 you can specify the number of trailing digests. You would use the following to achieve the corresponding results for an indicator normally referenced as #1.A#:
#1.A|0# -> 5
#1.A|1# -> 5.0
#1.A|2# -> 5.00
#1.A|3# -> 5.000
- Parameters
- Every Parameter to the Report is available by it's name prefixed with "parameter.". For example, #parameter.startDate#.
- Date parameters may be formatted by passing a pipe-separated Java Date Format String. For example #parameter.startDate|dd/MMM/yyyy#.
- Design Properties
- Every Design property is available by it's name prefixed with "property.". For example, #property.reportTitle#"
- Miscellaneous (including Contextual Information)
- #context.generatedBy# - Contains the name of the User who generated the Report. In some setups, this will be the default scheduled program user.
- #context.generationDate# - Contains the date on which the Report was generated (can be formatted in the same was as a Date Parameter described above)