Flowsheet Module
Overview
This module is designed with the concern of succinctly visualizing all available data for a single patient. This makes the task of visualizing data easy for the clinicians,by reviewing all results in reverse chronological order. This Flowsheet module is created with the purpose of providing a new way to view longitudinal data. More concern was given to the user interface of the module, in order to enable productive use by the clinicians.
Features of the module
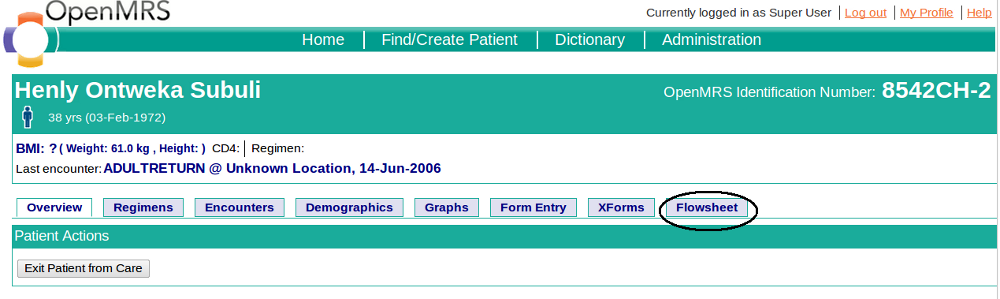
New Tab in the Patient Dashboard
Once the Flowsheet module is installed, there will be a new tab added to the Patient Dashboard, as show below:
Filtering Options Pane
On the left side of the main page of the flowsheet module, there is set of options to filter patient data. It has the following functionalities:
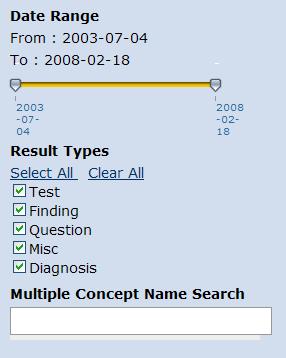
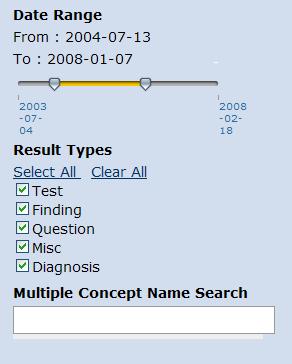
Date Range Selection
Two knobs of the date range slider can be moved between the date range of the oldest date and latest date of encounters. The slider shows these encounter dates. By adjusting the two knobs, the required date range can be selected. When the knobs are released, the observation details will be filtered according to the selection. Position of the knobs will be revealed by the dates shown above the slider in the From and To fields.
Result Type Selection
The observation types the patient has encountered are listed as option boxes. Required observation types can be selected from these options and get displayed on the right side pane
Select All Option
When clicked on the "Select All" label, all the "Result Type" options will be selected and the right side pane will be updated with filtered data
Clear All
When the "Clear All" label is clicked all the options under "Result Type" will be cleared and the right side pane also will be cleared
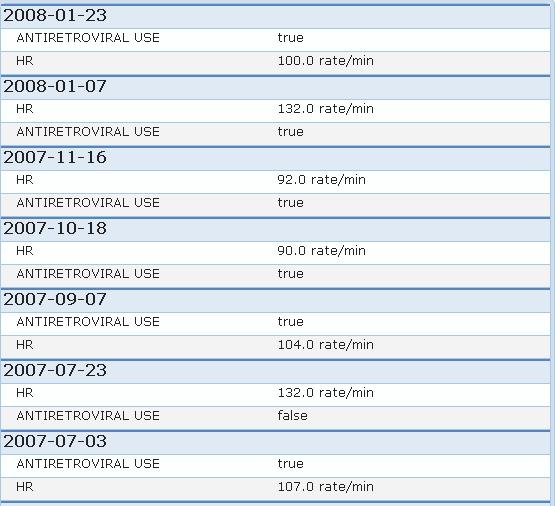
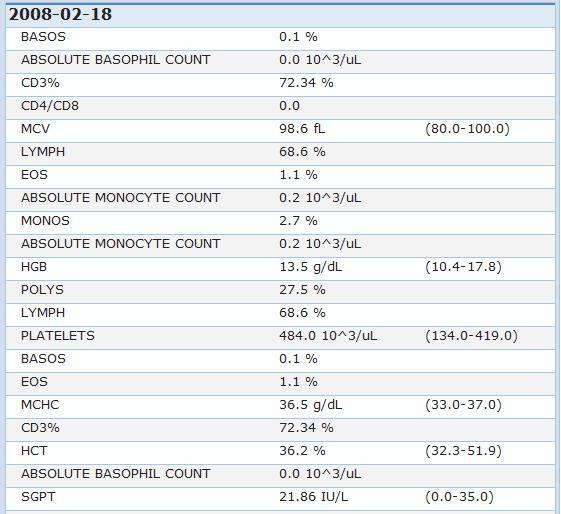
Patient Observations Pane
On the right side of the main page of the flowsheet module, there is an Observations pane, which lists the particular patient's observations in reverse chronological order. It basically shows the Concept name of the observation, the result of the observation and the Normal high and low values of that concept, if specified.
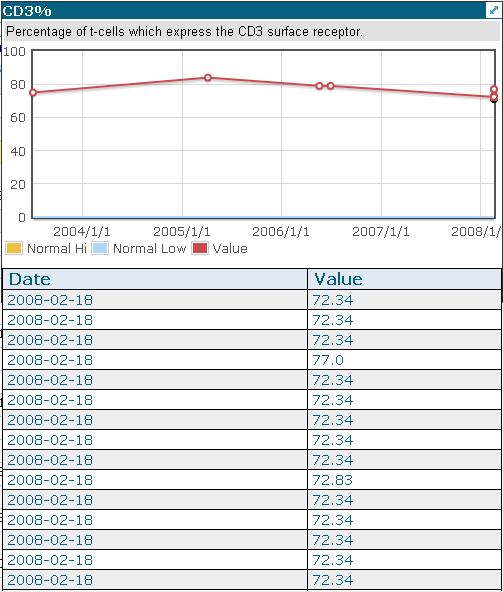
Flowsheet for Numeric-type Observation
When clicked on a numeric-type observation entry(an observation which has a result of numeric value or countable noun eg: weight) in the Patient observations pane, a pop-up will be shown beside the Observation grid. This window will have the flowsheet for the selected observation and a chart which visualizes the pattern of the observation values. In addition, details about the observation are also included.
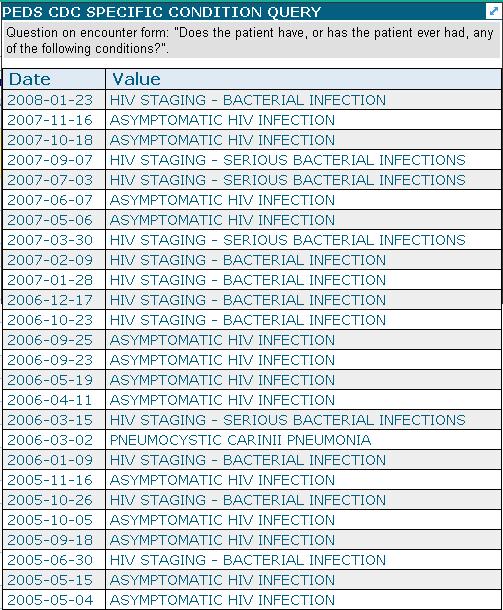
Flowsheet for Non-numeric Type Observation
When clicked on any non-numeric type observation entry in the "Patient Observations" pane, a pop-up will be shown which contains the flowsheet for that particular observation. In addition, details about the observation are included in the pop-up.
More Details of Single Observation
This section is still under development.
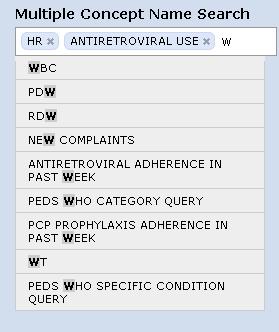
Search Observations by Concept Name
Observations listed in the right "Patient Observations" pane, can be filtered according to the Concept name of the observation. The search box is located in the left pane, below the Result Type Filter. It accepts multiple concept names as parameters. There is a predictive search feature which suggests possible concepts that the user might be looking for. Each selected concept has a 'x' icon, clicking it removes the Concept from the Search parameters.